Search for DBeaver alternatives and the same complaint keeps coming up: it uses a gigabyte or two of RAM while you're not doing anything, it takes ages to start, and it feels like Eclipse. We make a database client, so it would be easy to nod along and point at our download button. We measured it instead.
Short version: on a fresh install, DBeaver sat at about 420 MB, not 1.8 GB. Pilotbase Desktop, our own app, sat at about the same. If memory is what's bothering you, the fix is probably not a different desktop app.
How we tested
One Windows 11 laptop (Intel i5-12500H, 32 GB RAM). One PostgreSQL 16 database in Docker with two tables: customers (2,000 rows) and orders (50,000 rows). Two clients, each with a fresh profile:
DBeaver Community 26.2.2, the Windows zip from dbeaver.io with its bundled Java runtime, default settings. Pilotbase Desktop 3.0.0-beta10, the Windows installer from our GitHub releases.
In both we did the same three things: connect to the database, expand the tree down to the tables, open orders and look at the first page of rows. Then we stopped touching anything and read the memory every 10 seconds for about two minutes. We report private bytes (memory the app holds for itself) and working set (what Task Manager shows by default).
DBeaver: about 420 MB, flat
The first launch is the slow one. DBeaver opens a product configuration wizard, then asks to download the PostgreSQL driver the first time you connect. After that it's quick: on the second launch the main window, with the orders tab restored, was up in 6.7 seconds.
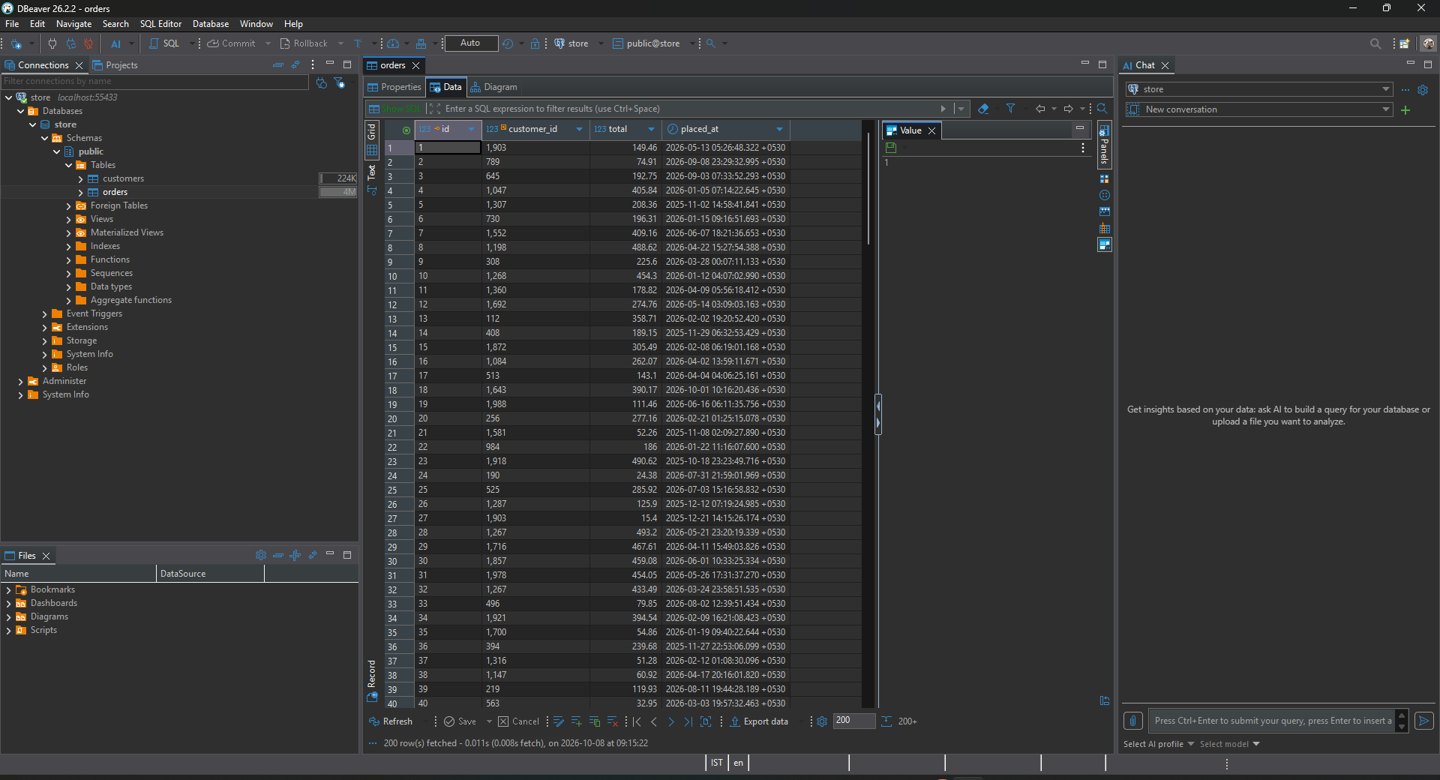
Sitting idle in that state, the numbers barely moved: working set 414 → 423 MB, private bytes 436 → 444 MB over 100 seconds, using a fraction of one CPU core. After a restart with the same tab restored and nothing clicked, it settled at 327 MB.
So where do the 1.8 GB stories come from? The shipped dbeaver.ini caps the Java heap at 1 GB (-Xmx1024m), and the JVM needs memory on top of the heap for its own code, threads and the native UI. A long session with a dozen editors, several connections and a few large result sets fetched in full can fill that heap, and people who hit an out-of-memory error are usually told to raise -Xmx. Do that, keep DBeaver open for a week, and 1.8 GB is believable. A fresh install doing nothing isn't that.
Pilotbase Desktop: about the same, honestly
Pilotbase Desktop is an Electron app with a Python backend that runs next to it. Same steps: add the connection, open orders, show the latest 50 rows.
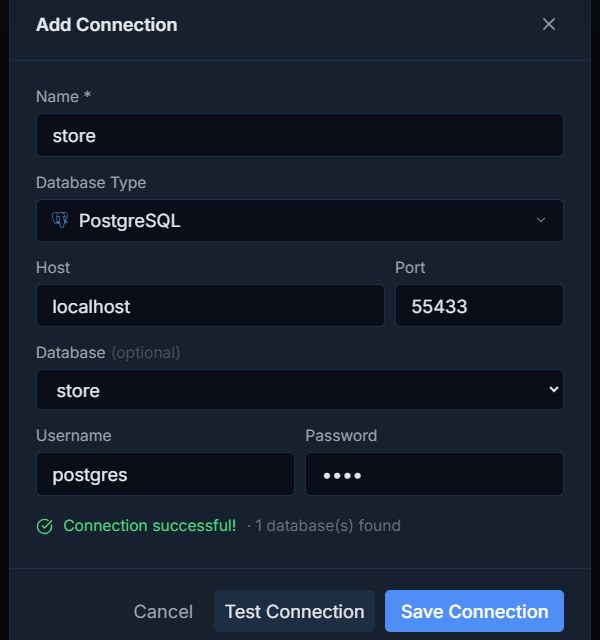
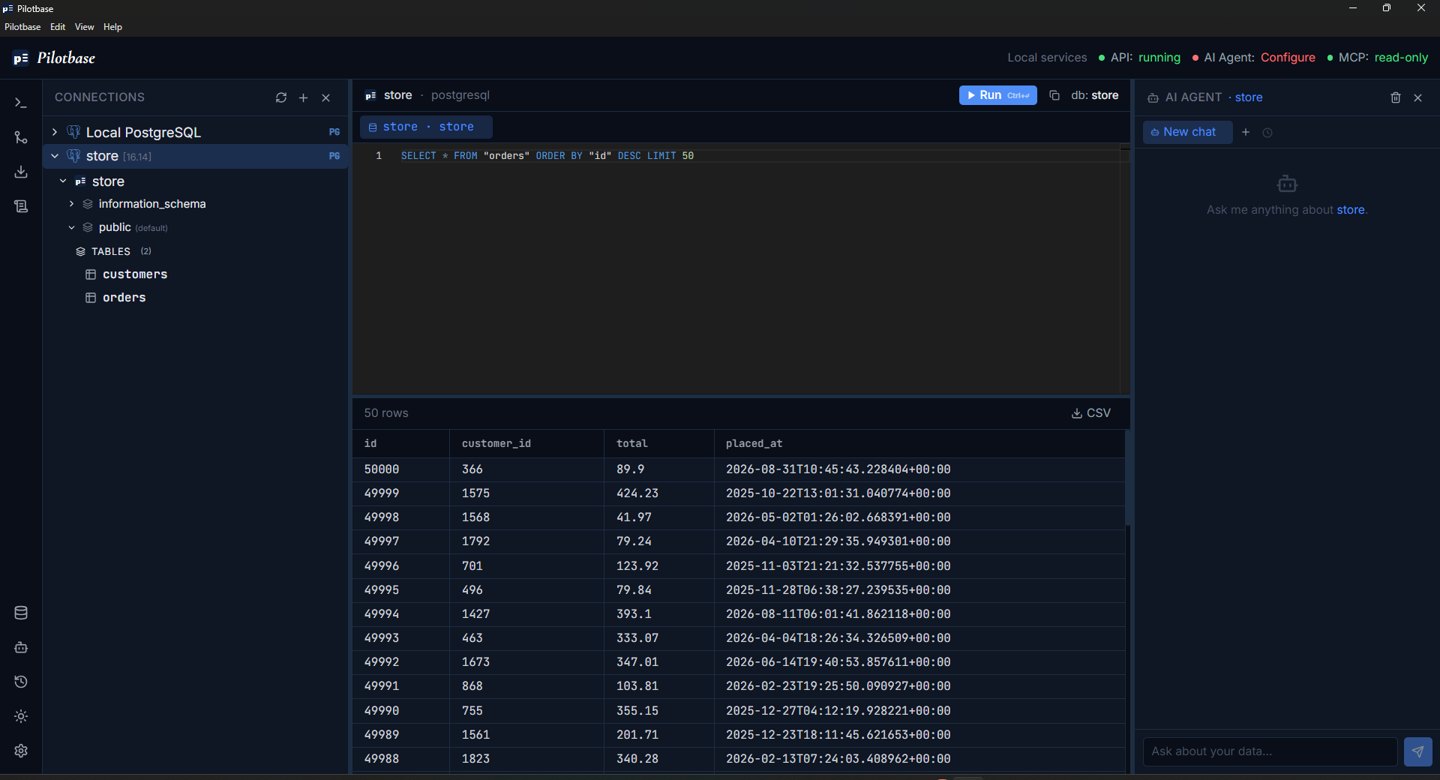
It runs as five processes: the Electron main process, a GPU process, a utility process, the page renderer, and the Python API. Together: 448 MB private, 637 MB working set idle. The working-set sum overstates things a bit, because several processes share the same pages, which is why private bytes is the fairer figure here. Either way, that's level with DBeaver, not lighter.
It's also bigger on disk: 557 MB installed against 195 MB for the DBeaver folder. Electron brings its own copy of Chromium, and the backend brings its own Python.
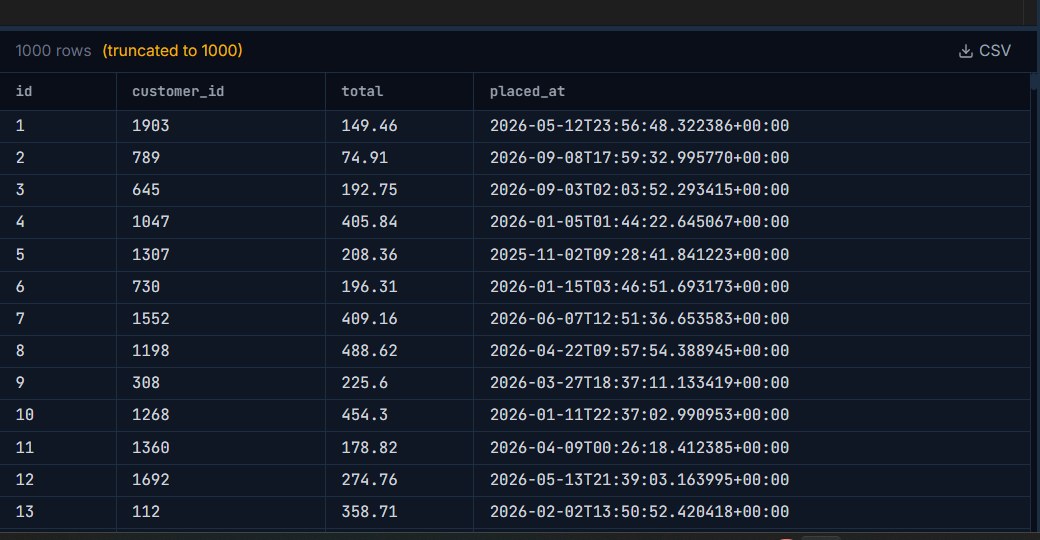
One design choice does keep Pilotbase's memory in check as you work. A query result is capped at 1,000 rows in the grid (export to CSV for more), so a careless SELECT * FROM orders can't pull 50,000 rows into the window. After that query, memory went to 508 MB private and stayed there. DBeaver fetches 200 rows at a time and lets you fetch everything, which is more flexible and also how a session ends up at a gigabyte.
If RAM really is the problem
Trim DBeaver first. Lower -Xmx in dbeaver.ini if your databases are small (raise it back if you ever see an out-of-memory error), close result tabs you're done with, and don't use "fetch all rows" on big tables. That costs nothing and keeps the tool you already know.
Or move the client off your laptop. A web client on a server leaves only a browser tab on your machine. In our Pilotbase Desktop measurement, the page renderer was 143 MB of the working set and the Python API 191 MB; in Pilotbase's Docker version the API runs on the server and the page is just a tab. Adminer, pgweb and CloudBeaver work the same way.
Then pick on what they do, not on memory
DBeaver is the better tool when you edit data by typing into a grid, want ER diagrams, or manage deep database objects. It has had years to cover all of that.
Pilotbase is the better tool when you work across several engines (19, from Postgres and MySQL to MongoDB, Redis and vector databases) and want one connection form for all of them, an AI agent that shows a plan and waits for your approval before it changes anything, cross-engine migrations, and an MIT licence you can self-host in Docker.
Neither should cost you 1.8 GB on a quiet afternoon. If yours does, look at how long it's been open before you look for a replacement.
Try Pilotbase on your own database: desktop for Windows, macOS and Linux, or Docker on a server. Free and MIT-licensed.
Get PilotbaseSources
Our measurements: 8 October 2026, Windows 11 Pro, Intel i5-12500H, 32 GB RAM; DBeaver Community 26.2.2 (dbeaver.io zip, bundled JRE, default dbeaver.ini with -Xmx1024m); Pilotbase Desktop 3.0.0-beta10 (GitHub release); PostgreSQL 16 (Docker, postgres:16-alpine). Memory read from Windows process counters (private bytes and working set) every 10 seconds while idle. What people report about DBeaver: DbVisualizer, best DBeaver alternatives. Heap setting: DBeaver docs, command line and dbeaver.ini parameters. Web clients: Adminer, pgweb, CloudBeaver.

Comments (0)
Loading comments…