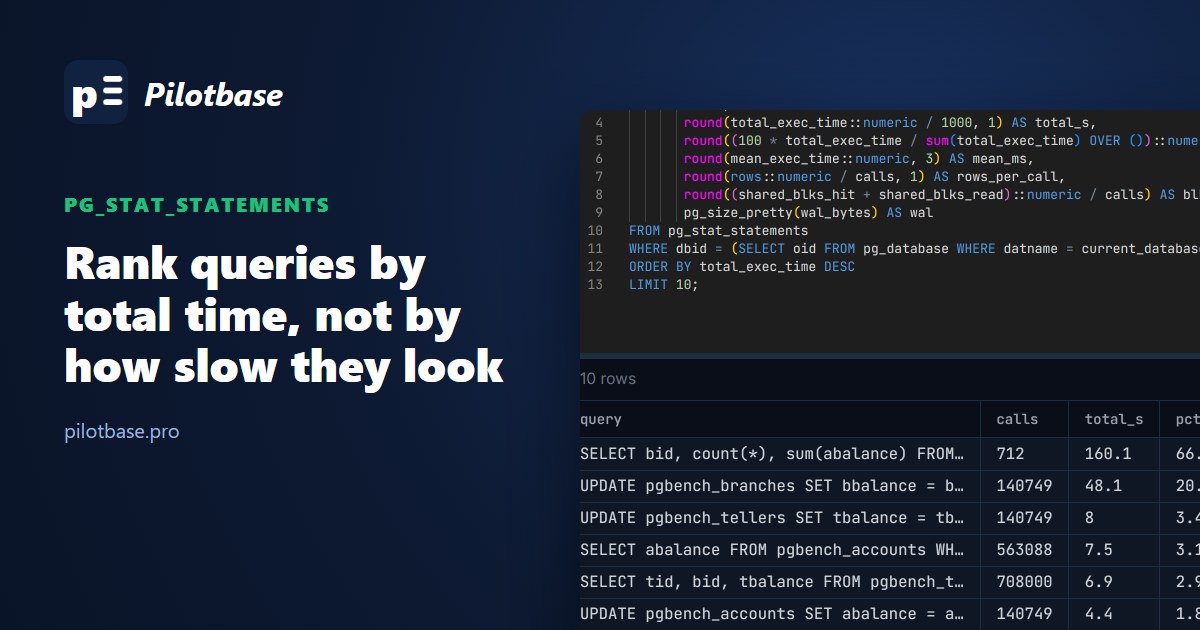
When a Postgres database feels slow, the first instinct is to look for the slowest query. That's usually the wrong one. The query that takes 500 ms once an hour costs less than the one that takes 50 ms a hundred times a minute, and neither shows up in a log you'd think to read. pg_stat_statements keeps a running total for every distinct statement the server runs, and sorting it the right way tells you where the time actually goes.
We ran a mixed workload on PostgreSQL 18 with a few problems planted in it, ranked the statements five different ways, fixed the top one, and measured what changed. Here's the setup, the queries to rank with, what each ranking is good for, and what pg_stat_statements doesn't see.
Turn it on
The extension ships with Postgres but has to be loaded at server start, then created in each database you want to query it from:
Most hosted Postgres services have it loaded already, and some have it created too; SELECT * FROM pg_extension tells you. Defaults that matter: it keeps up to 5,000 distinct statements (pg_stat_statements.max, least-used ones are evicted), tracks top-level statements only (pg_stat_statements.track = top, so statements inside functions are counted as part of the call), and survives restarts.
Counters add up from the last reset, so for a clean picture, reset and let a normal day (or a known workload) run:
The workload
PostgreSQL 18.6 in docker, pgbench at scale 20 (2 million accounts) plus 2 million extra rows in pgbench_history, 8 clients for 120 seconds. Next to pgbench's own TPC-B transaction we ran the kind of statements a real app sends:
And from a separate session, every 5 seconds, a join report run with statement_timeout = '50ms', which was cancelled all 20 times. The whole mix ran at 1,381 transactions a second.
Ranking 1: total time (start here)
One statement was 88% of all the time the server spent executing queries: the history lookup. It ran only 3,437 times, 2% of the transactions, but each call read 12,851 blocks (100 MB of pages, from memory) to return one row. That combination, a high share of total time and a lot of blocks per row returned, is the signature of a missing index. It's query number one to tune.
pct is the column to read first. If your top statement is 3% of the total, there's no single big win and the time is spread across the app; if it's 40% or more, fix that one before anything else. blks_per_call divided by rows_per_call tells you how much the server reads per row it hands back; a few blocks per row is an index doing its job, thousands is a scan.
Fixing number one, then ranking again
Take the query text, put a real value in for $1, and look at the plan:
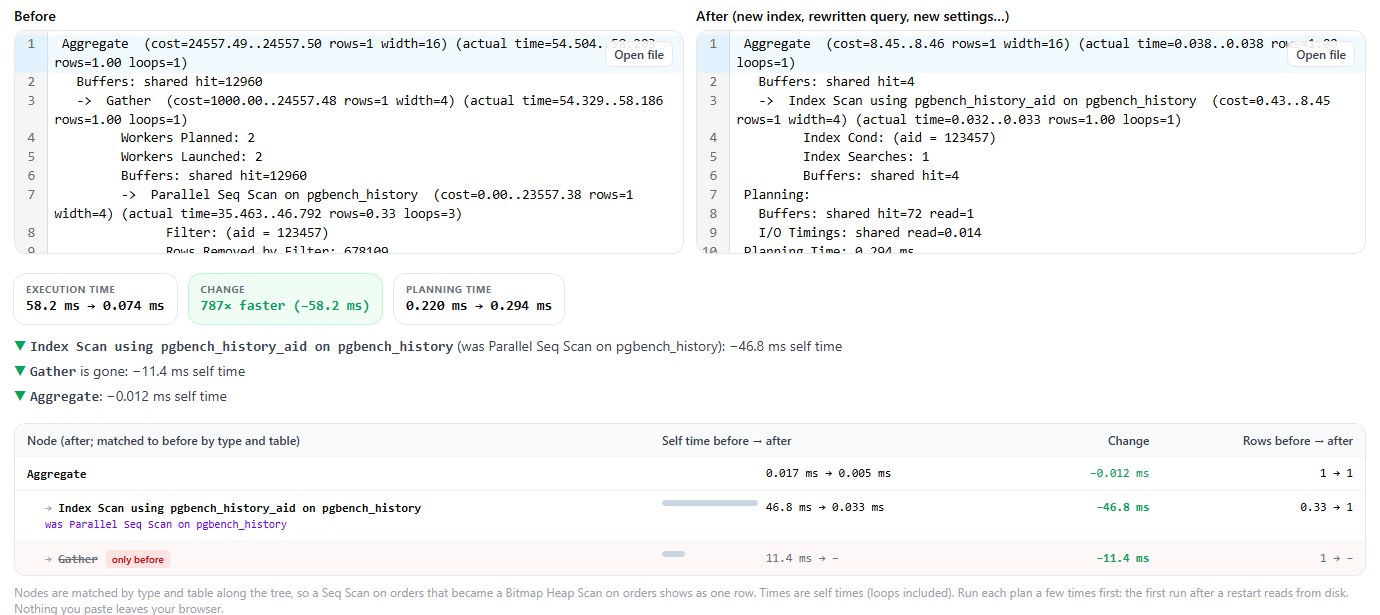
explainViewer puts the two plans side by side: 58.2 ms to 0.074 ms, the parallel seq scan replaced by an index scan. On an idle server the scan took 58 ms; under the workload its mean was 198 ms, because eight clients were scanning at once. That's another reason to rank by what the server actually recorded rather than by what one test run in psql shows.
Then reset and run the same 120 seconds again:
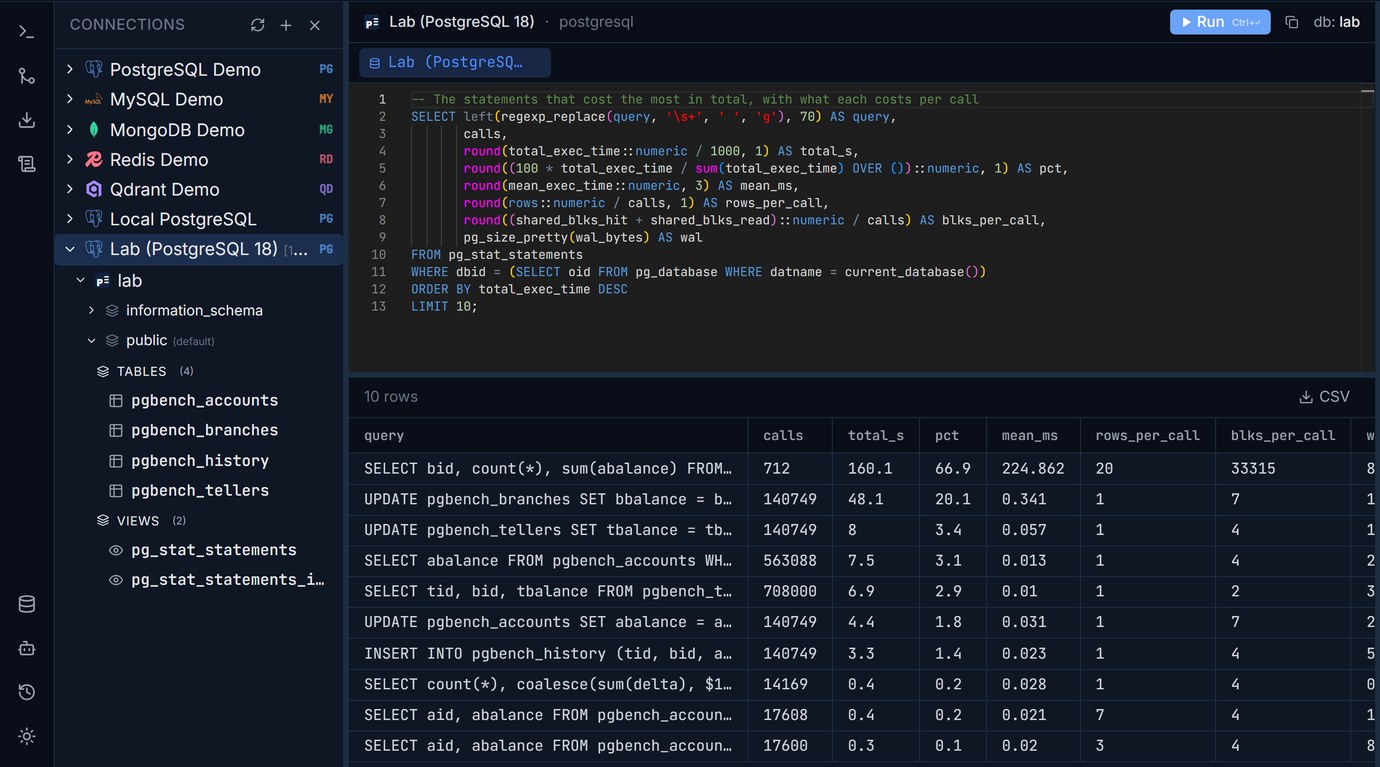
Throughput went from 1,381 to 5,690 transactions a second, 4.1 times, from one index. The history lookup dropped to 0.2% of the time. And the ranking moved: the report is now first at 67%, and the branch balance update is second at 20%. That's how you use this view: fix the top one, reset, rank again. Each round tells you the next thing worth doing, and when the top entry is a small share, you're done with the database side.
Ranking 2: mean time (useful, but not first)
Sorted by mean, the first run's top entry was the report (527 ms a call), ahead of the history lookup (198 ms). If you'd started there, you'd have spent your morning on 10% of the load and left the 88% alone. Mean time matters for one thing: queries a person waits for. If that report backs a page someone opens, 527 ms is worth fixing even at 10% of the server's time. Look at max_exec_time and stddev_exec_time there too; a mean of 5 ms with a max of 4 seconds is a statement that sometimes waits on a lock or a cold cache.
Ranking 3: calls against rows (the N+1 pattern)
The teller lookup ran 171,790 times in two minutes, one row each: exactly ten times the 17,179 runs of the script that loaded ten tellers one by one. In the database it cost almost nothing (0.009 ms a call, 0.2% of the time). The cost is outside the database: each call is a network round trip, and on a real network at 0.5 ms a round trip, those ten calls are 5 ms of waiting per page view that pg_stat_statements never sees. A statement with a huge calls count, one row per call and a query shape like WHERE id = $1 is worth finding in the app code and turning into one WHERE id = ANY($1).
Ranking 4: blocks read, not just hit
shared_blks_read counts blocks that weren't in Postgres's own cache and had to come from the OS cache or the disk; shared_blks_hit counts the ones that were. Our test table fit in memory so reads were near zero, but on a real database with more data than RAM, ranking by shared_blks_read (and shared_blk_read_time, if track_io_timing is on) finds the statements that push useful pages out of the cache for everyone else. Large reports and exports are the usual ones; moving them to a replica is often the fix.
Ranking 5: WAL written (PostgreSQL 13+)
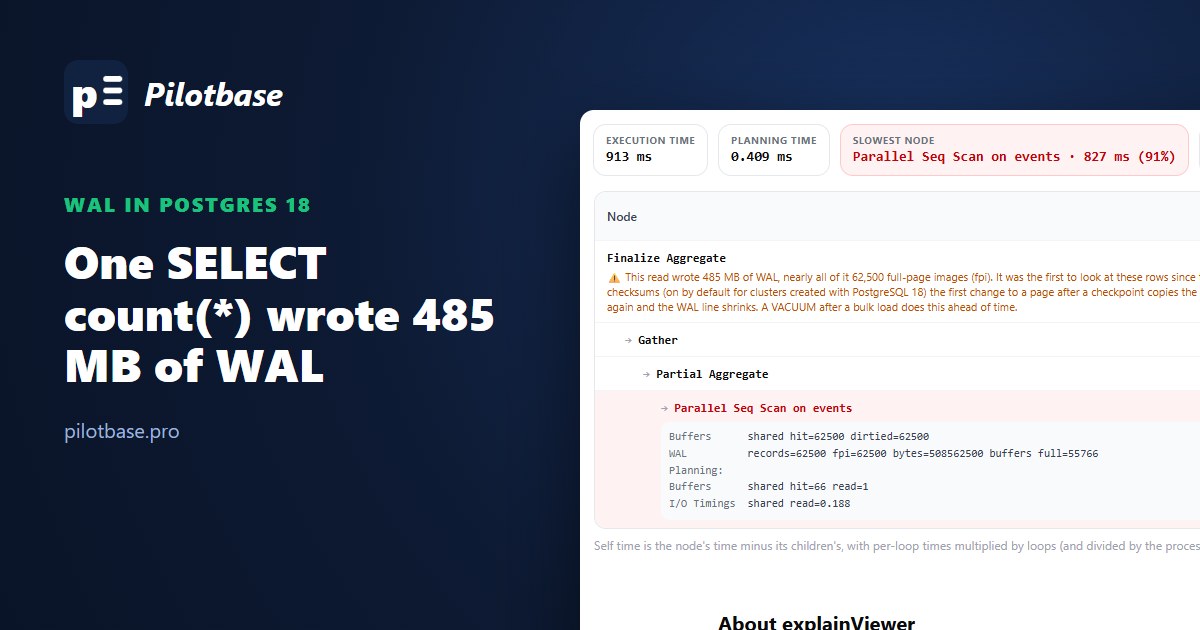
This finds the statements that make your replicas lag and your WAL archive grow. Two things to notice here. The account update wrote 2,198 bytes a call, and 37,035 of its records were full-page images: it touches random pages of a 2-million-row table, and the first change to each page after a checkpoint copies the whole 8 kB page into the WAL. Fewer, longer checkpoints (a bigger max_wal_size) or wal_compression cut that. And the report, a plain SELECT, wrote 8.7 MB of WAL: reading rows that other sessions had just updated, it set hint bits and pruned pages. We measured that effect in detail in A SELECT that wrote 485 MB of WAL.
The history INSERT also shows the price of the fix: with the new index on aid, each insert now writes to one more index, and its WAL per call went up. Usually worth it, as here, but it's a trade you can see in this view.
What it normalises, and what it doesn't
Statements are grouped by their parsed shape, with constants replaced by $1, $2, and so on. PostgreSQL 18 goes further with lists of constants: IN (1, 2, 3) and IN (4, 5, 6, 7, 8, 9, 10) were counted as one statement, shown as IN ($1 /*, ... */). An array parameter (= ANY($1)) was always one entry. But our pgbench IN lists, built from expressions (:a + 1), stayed two separate entries, one per list length; an ORM that writes IN ($1, $2, $3) with bind parameters may also produce one entry per length, depending on your driver. If you see the same query many times with different numbers of placeholders, add them up before ranking.
The grouping is per user and per database too, so the same statement run by two roles appears twice. Sum by queryid when you want one number for it.
What it doesn't see
Statements that fail or are cancelled. Our timed-out join report was cancelled 20 times in two minutes, each after 50 ms of work, and there's no trace of it in pg_stat_statements (only the SET statement_timeout before it appears). Only statements that complete are counted. To catch them, log them: log_min_error_statement (default error) writes the text of the statement that failed, and log_min_duration_statement logs the ones that finish slowly.
Per-node detail. It tells you which statement costs the most, not which part of its plan. For that, run EXPLAIN (ANALYZE, BUFFERS) with real values, or load auto_explain with auto_explain.log_min_duration to log the plans of slow statements as they happen.
Time spent outside the server. Network round trips, connection setup and time the app spends between statements aren't in total_exec_time. A transaction that sits idle in transaction while the app does other work doesn't show here at all, even though it holds locks.
Lock waits, separately. They're inside the execution time but not broken out. Our branch update's mean of 0.341 ms was mostly waiting for other sessions updating the same 20 branch rows. If a cheap statement has a high mean and a high stddev, check pg_stat_activity for wait_event_type = 'Lock', or turn on log_lock_waits.
A routine that works
Once a week, or after a release: rank by total time, check the top entry's share. If it's big, take its text, run EXPLAIN (ANALYZE, BUFFERS) with real values, fix it, reset, rank again a day later. Look at calls-versus-rows for N+1 patterns to hand back to the app, and at wal_bytes when replicas fall behind. Keep the queries above in a saved file in your SQL client so this takes five minutes rather than an afternoon.
Keep these ranking queries next to your connections in Pilotbase and open the top statement's plan in one click. PostgreSQL, MySQL and the other engines in one app: desktop for Windows, macOS and Linux, or Docker on a server.
Get PilotbaseSources
PostgreSQL documentation: pg_stat_statements (columns, normalisation, the list squashing in PostgreSQL 18, settings and reset), auto_explain, error and slow statement logging, pgbench. All numbers are from our own runs on PostgreSQL 18.6 in docker; the scripts are a pgbench mix, so treat the absolute numbers as an example and the method as the point.
Comments (0)
Loading comments…