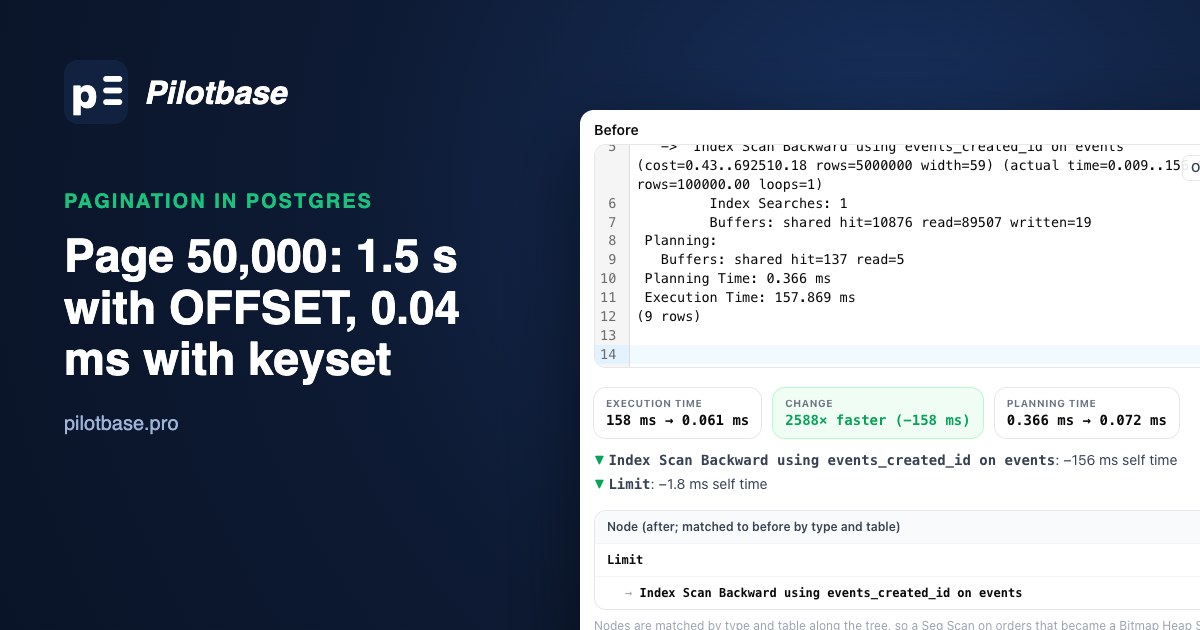
Most list endpoints start life as ORDER BY created_at DESC LIMIT 20 OFFSET :n. It's easy to write, easy to turn into page numbers, and fast in testing, because in testing nobody goes past page 3. Then a crawler, an export job or one patient user walks to page 4,000 and the query that took a fraction of a millisecond takes seconds.
We measured how fast it gets worse on a 5 million row table, then rewrote the same pages as keyset queries (also called the seek method) and worked through what goes wrong with them: ties in the sort column, NULLs, mixed sort directions, page numbers, and text keys whose order depends on the collation.
The test table
PostgreSQL 18.6 on an Apple M4 Mac mini, default settings (shared_buffers 128 MB). One table of 5 million events over 30 days, created_at rounded to the second so that many rows share a timestamp, as they do in real tables. The heap is 1,056 MB and the index on (created_at, id) is 150 MB.
Each page is 20 rows, newest first. The OFFSET query and the keyset query return the same rows (the script checks that), and each was run three times after a warm-up run.
OFFSET reads every row it skips
The keyset query costs the same on page 200,000 as on page 1: about 23 buffers, a few hundredths of a millisecond. The OFFSET query grows with the page number, and not quite in a straight line: from page 500 to page 5,000 it went from 5.6 ms to 155 ms, 28 times slower for 10 times the rows, because the rows it walks past no longer fit in the 128 MB of shared buffers and start coming from the operating system's cache instead.
The PostgreSQL manual says it in one sentence: "The rows skipped by an OFFSET clause still have to be computed inside the server; therefore a large OFFSET might be inefficient." Computed here means fetched. The plan for page 5,000 walks the index backwards and visits the table for all 100,000 rows, just to throw 99,980 of them away:
And the keyset query for the same page goes straight to the spot in the index where the last page ended:
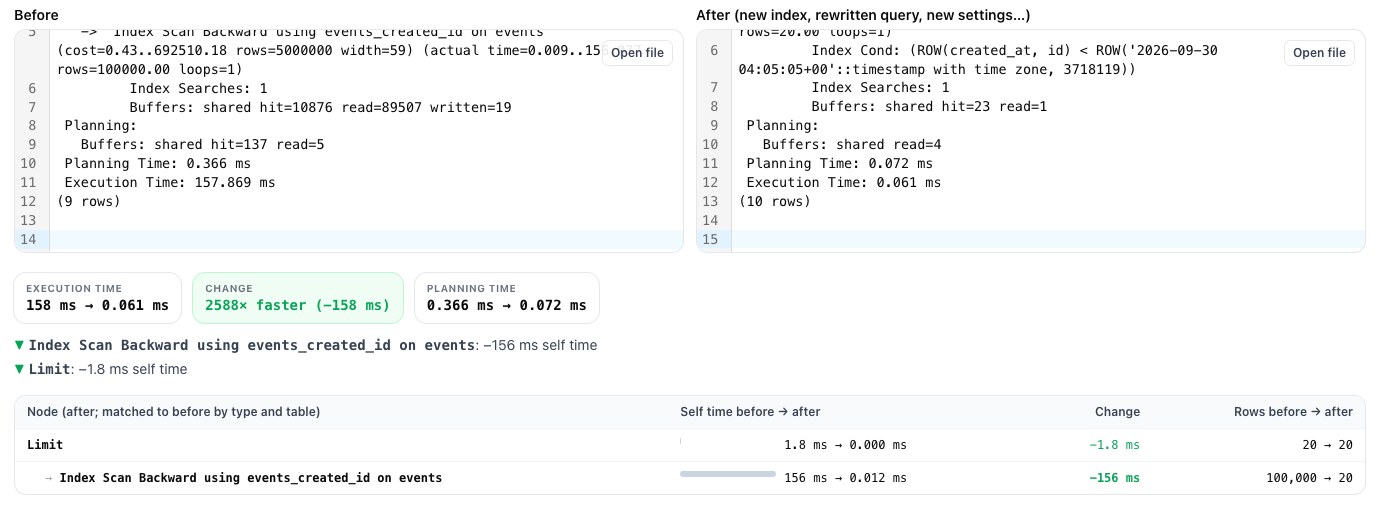
Pasting both into explainViewer with Compare two plans matches the nodes up and shows where the time went: 156 ms of the 158 is the index scan, which read 100,000 rows to return 20.
There's a second problem with OFFSET that has nothing to do with speed. Rows that arrive while someone is paging shift everything down. We loaded ten rows, fetched page 1 (rows 10, 9, 8), inserted two new rows, and fetched page 2 both ways. OFFSET returned 9, 8, 7: two rows the reader had already seen. Keyset returned 7, 6, 5, because it asks for rows older than the last one seen, not for the rows in position 4 to 6. Deletes do the opposite to OFFSET, and rows get skipped without anyone noticing.
The row comparison, and the index it needs
(created_at, id) < (:ts, :id) is a row comparison. Postgres compares the elements left to right and stops at the first pair that differs, so it means "created_at is earlier, or it's the same and id is lower", which is exactly the order of ORDER BY created_at DESC, id DESC. The btree index on (created_at, id) stores rows in that order, so the planner turns the comparison into an Index Cond, a starting point in the index, and reads 20 entries from there.
What happens with less index:
With an index on created_at alone, Postgres still used the first element of the row comparison as an index condition and sorted each group of equal timestamps by id (Incremental Sort). That's fine while a timestamp is shared by a handful of rows. It gets slower when thousands share one, which happens after a bulk import that stamped every row with the same now(). The two-column index costs little extra and removes the question.
Ties: why the id is in there
It is tempting to page on the timestamp alone: WHERE created_at < :last_created_at. Our 5 million rows have 2,215,566 distinct timestamps, so most rows share their second with at least one other row. When a page ends in the middle of such a group, the rest of the group is older-or-equal, not older, and the next page skips it.
We walked 200 pages that way. They returned 4,000 rows; the time range they covered holds 4,200. Five percent of the rows were never shown to anyone, and nothing failed. Using <= instead repeats rows rather than skipping them, and if more than one page of rows shares a timestamp, it repeats the same page forever. The fix is a unique last sort key, usually the primary key, in the ORDER BY, in the cursor and in the index.
Mixed directions: the row comparison stops working
A row comparison only expresses one direction. For ORDER BY created_at DESC, id ASC it gives the wrong answer, and you have to spell the condition out. The obvious way to write it was slow:
Postgres can't turn an OR across two columns into a single starting point in the index, so the plan scanned the index and filtered row by row until it reached the cursor. It took 100 ms with the (created_at, id) index and 104 ms with a matching (created_at DESC, id ASC) index. Adding a redundant condition on the leading column gives the planner its starting point:
If you can choose, sort every key the same way and keep the row comparison. Ties are broken by id only to make the order stable, so its direction rarely matters to the reader.
NULLs fall off the end
A row comparison with a NULL in it is neither true nor false, so rows with a NULL sort key never match a keyset condition. With six orders sorted by shipped_at (NULLS LAST is the default for ascending order), page 1 returned the four shipped orders and page 2 returned nothing, although two unshipped orders were still to come:
Three ways out, in order of preference. Make the column NOT NULL if NULL doesn't mean anything. Otherwise page on a column that is never NULL. Or handle the NULL tail as its own case: while the cursor is on a non-NULL value, add OR shipped_at IS NULL (which returned the two missing rows), and once the cursor is on a NULL row, continue with WHERE shipped_at IS NULL AND id > :id. The client then has to send whether the last value was NULL as part of the cursor, which is one more reason to hand clients an opaque cursor rather than raw column values.
Jumping to page 4,000
Keyset pagination has no page numbers. You can go to the next page, to the previous one (flip the comparison and the sort, then reverse the 20 rows), to the first and to the last, but not to page 4,000 without walking there. For a feed, an API or an export that is no loss: an API should return a next cursor, and an export should page by keyset or not page at all. For an admin screen that really needs numbered pages, two things help.
Skip in the index, then fetch. OFFSET is slow mostly because it visits the table for every skipped row. Skipping inside the index and joining back for the 20 rows you keep (a "deferred join") made page 5,000 take 8.0 ms instead of 155 ms, and page 50,000 83 ms instead of 1,533. It still grows with the page number, only about 19 times more slowly, because the skipped rows are read from the 150 MB index (an Index Only Scan) instead of the 1 GB table.
This needs the table to be mostly all-visible (recently vacuumed) for the index-only scan to skip heap visits, which you can check in the plan's Heap Fetches line.
Don't count exactly. "Page 12 of 250,000" needs a count(*), which took 50-76 ms here and runs on every request. reltuples in pg_class gives the planner's estimate instantly (5,000,032 here, for 5,000,000 rows) and is good enough for "about 250,000 pages". Few people miss the exact last page number; search engines show "about" counts for the same reason.
Text keys: the cursor must sort the way the index does
Paging by name or title works the same way, (title, id) > (:title, :id), with one more thing to match: the collation. The order of text depends on it, and the order is what a keyset query relies on. The same eight names sorted two ways:
"The page after Banana" is Zebra, _draft, apple, eclair, Éclair in one and eclair, Éclair, Zebra in the other. A cursor is only meaningful under the collation the list was sorted with. That bites when the next page's condition is built or checked outside the database (sorting the rows in application code, merging two sources, or caching pages in a store that compares bytes): the code and the database disagree about what comes after Banana, and rows get skipped or repeated.
Inside Postgres, the index collation has to match the query's. An index built COLLATE "C" to make sorting cheaper (the subject of our article on text sorting) is not used by a query that compares under the database's default collation:
Pick one collation for the paging column, use it in the index, the ORDER BY and the comparison, and leave the comparing to the database. C is fastest and stable across operating-system upgrades; a linguistic collation gives the order people expect to read, so choose it when users see the list in alphabetical order.
A checklist for a keyset endpoint
1. ORDER BY ends with a unique column, usually the primary key. 2. One btree index on exactly the ORDER BY columns, in that order. 3. All keys sorted the same direction so a row comparison works; otherwise the expanded form with a leading-column bound. 4. Sort columns NOT NULL, or the NULL tail handled explicitly. 5. The cursor is the last row's sort values, encoded (base64 JSON is fine) so clients treat it as opaque. 6. Text keys: one collation in the index, the ORDER BY and the comparison. 7. Check the plan: an Index Cond on the row comparison and about 20 rows read, not a Filter.
To skip writing the condition by hand, paste your ORDER BY into keysetBuilder. It writes the first-page and next-page queries for PostgreSQL, MySQL 8 or SQLite (the row comparison when it's safe, the expanded form with the leading bound when directions are mixed, NULLs handled explicitly), the matching index and a cursor sample, and every query it writes has been run against the real engines.
The last check is the quickest. Run the query with EXPLAIN (ANALYZE, BUFFERS) for a page near the start and one far in, and compare them in explainViewer. If the far page reads more buffers than the near one, something in the list above is missing. When the near page is the slow one, the planner may be misjudging how many rows match: When Postgres guesses wrong covers that case.
Try the OFFSET and keyset queries against your own tables in Pilotbase, with the plan one click away. Desktop for Windows, macOS and Linux, or Docker on a server.
Get PilotbaseSources: PostgreSQL 18 documentation, LIMIT and OFFSET (quoted on skipped rows), Row Constructor Comparison (left-to-right comparison, NULL makes the result unknown), Indexes and ORDER BY, Collation Support; Markus Winand, Paging Through Results and No Offset, the usual reference for the seek method. Every number and plan here is from our own runs: PostgreSQL 18.6 (Homebrew) on an Apple M4 Mac mini, default settings, a 5 million row table; three runs after a warm-up, ranges are the fastest and slowest.
Comments (0)
Loading comments…