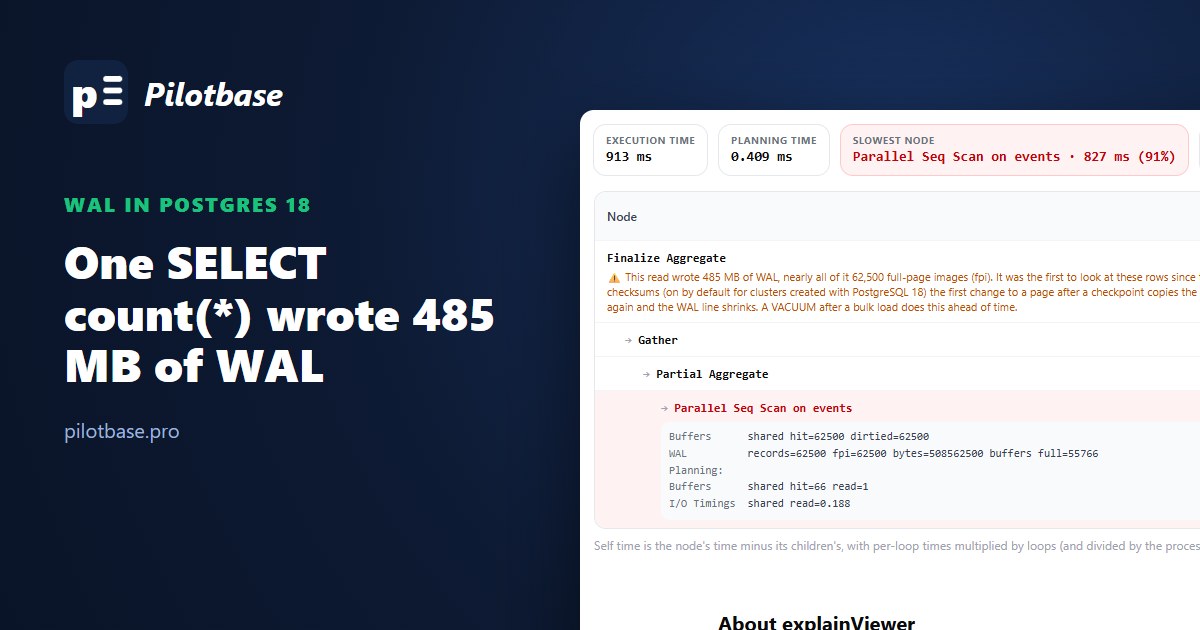
We loaded 4 million rows into a fresh PostgreSQL 18 table, waited for a checkpoint, and ran SELECT count(*). The query took 913 ms and wrote 485 MB of WAL. The table itself is 488 MB. A read-only query had just copied almost the entire table into the write-ahead log. We ran the same count again: 167 ms, and no WAL at all.
Nothing is broken. This is hint bits meeting data checksums, and since PostgreSQL 18 turned checksums on by default for new clusters, more people are going to run into it: a replica that lags after a quiet night, a WAL archive that grows on a day nobody wrote anything, a morning report that is slow exactly once. Below is the reproduction, how to spot it in a plan, and how to pay the cost at load time instead of on the first read.
What a hint bit is
Every row version in a Postgres heap page carries the ID of the transaction that created it (xmin). To decide whether a row is visible, a reader has to know whether that transaction committed. The answer lives in the commit log (pg_xact), and looking it up for every row on every read would be slow. So the first reader that does the lookup writes the answer onto the row as a hint bit: "inserter committed". Later readers check the bit and skip the lookup.
Setting that bit changes the page, so the page is now dirty and has to be written back to disk at some point, even though your query only read. On a cluster without checksums that's the whole cost: extra writes from the checkpointer, nothing in the WAL. Losing a hint bit in a crash is harmless; the next reader works it out again.
Why checksums turn it into WAL
With data checksums, every page carries a checksum of its contents. A hint bit changes the contents, so it changes the checksum. If the server crashed halfway through writing that page (a torn page), the half-old, half-new page would fail its checksum and there would be nothing in the WAL to repair it from. To prevent that, Postgres logs a full-page image (FPI) of a page the first time it's modified after each checkpoint, even when the change is only a hint bit. wal_log_hints = on does the same on a cluster without checksums (pg_rewind needs it); with checksums on, that setting is ignored because hint bits are always logged.
So: the first time any session sets a hint bit on a page after a checkpoint, the whole 8 kB page goes into the WAL. A bulk load creates millions of rows with no hint bits, spread over every page of the table. The first query that reads them all pays for the whole table.
PostgreSQL 18 made this the default. From its release notes: "Change initdb default to enable data checksums", with a new --no-data-checksums option. pg_upgrade needs matching checksum settings, so a cluster upgraded from 17 keeps what it had; a cluster created fresh on 18 (a new docker volume, a new VM, a new test environment) has checksums on. Check yours:
The reproduction
PostgreSQL 18.6 in the official postgres:18 docker image, 16 cores, shared_buffers 1 GB (so the table sits in memory and we measure WAL, not disk reads) and max_wal_size 8 GB (so no checkpoint fires during the load on its own). A second container started with POSTGRES_INITDB_ARGS=--no-data-checksums is the control. Autovacuum is off on the table for the clean runs; otherwise it wanders in halfway through and does part of the work.
WAL was measured two ways: the WAL: line that EXPLAIN (ANALYZE, WAL) prints for the statement itself, and pg_wal_lsn_diff() between pg_current_wal_lsn() before and after, which also catches anything a background process wrote in between. pg_stat_wal turned out to be a poor fit for this: parallel workers flush their counters late, and in one run a third of the first query's WAL showed up after we had reset the view for the second.
What the first read wrote
Read it from the bottom. shared hit=62500: every page came from memory, no disk reads. dirtied=62500: and yet every one of them was modified. WAL: records=62500 fpi=62500: one WAL record per page, each a full-page image. bytes=508562500 is 485 MB. buffers full=55766 is new in PostgreSQL 18: that many times the session found the WAL buffers full and had to write WAL out itself before going on. That's where most of the extra 750 ms went.
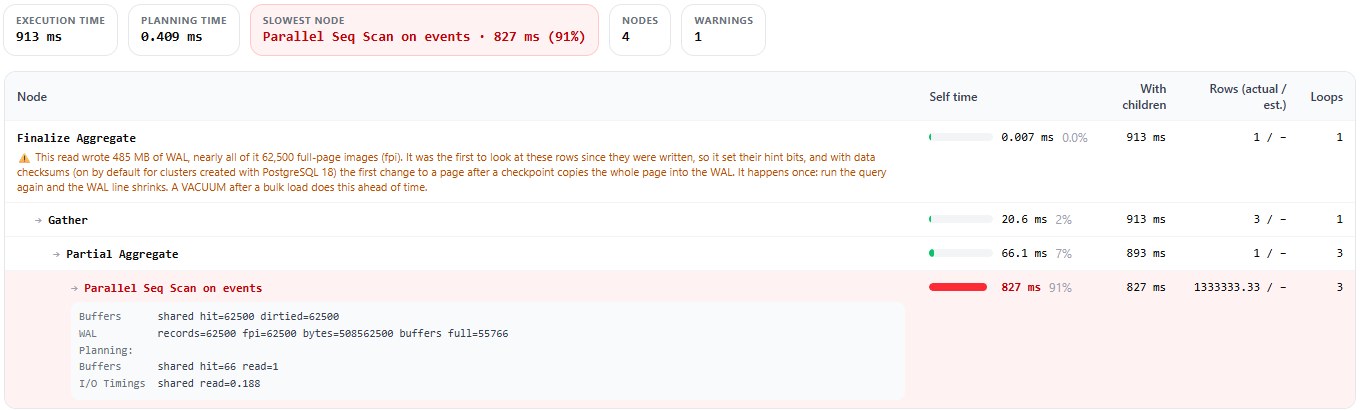
Paste the plan into explainViewer and it says the same thing in words: a read that wrote WAL made mostly of full-page images gets a warning with the reason and the fix. That matters, because the WAL: line only appears when you ask for WAL in the EXPLAIN options; without it the plan looks like any slow seq scan.
All the runs, on the same 4M-row table:
Three things stand out.
The checkpoint is the trigger. Read the table right after the load, before any checkpoint, and there is no image to write: each page was logged in full by the load itself, and a hint bit on top of that isn't logged again until the next checkpoint. After a checkpoint (by default at most checkpoint_timeout, 5 minutes, away) the next change to each page needs a fresh image. In practice the report, export or dashboard that reads the new rows almost always runs after one.
Without checksums the pages are still dirtied. dirtied=62500 shows up in the control run too. Those 488 MB still get written back to the data files by the checkpointer or the background writer. They just don't go through the WAL, so they don't reach replicas or the archive.
wal_compression shrinks the bytes, not the time. lz4 cut the WAL by 27% here and zstd by 57% (hex md5 text compresses worse than typical application rows), but the CPU cost made the query slower, not faster. If replicas or the archive are your bottleneck, compression is still worth having; it applies to every full-page image, not just these.
It's not only count(*)
Any statement that looks at the rows sets the bits on the pages it visits. Two that surprised us:
ANALYZE. Run right after a checkpoint, ANALYZE events wrote 234 MB of WAL. It samples 30,000 pages (300 times the default statistics target of 100), checks each sampled row's visibility and sets hint bits on everything it touches. Autovacuum's automatic analyze after a load does the same.
A small index scan. Reading 40,000 rows by primary key, about 1% of the table, dirtied 315 pages and logged 315 images, 2.4 MB (ANALYZE had already hit the other pages in that range). Over a day of normal traffic that's a steady drip of full-page images on freshly loaded data instead of one burst, and it's one reason WAL volume on a read-heavy primary can look higher than its write traffic explains.
Who pays: the primary, replicas and backups
The primary pays in latency (those 750 ms) and WAL writes. But WAL goes everywhere: every byte of the 485 MB is streamed to each physical replica and replayed there, and archived by whatever ships your WAL (pgBackRest, WAL-G, archive_command). A nightly bulk load followed by a morning report means a 500 MB WAL burst at report time, on a database that wrote nothing new. If a replica's network link or replay is the bottleneck, that's replication lag with no write load to explain it. With incremental backups (pg_basebackup --incremental, PostgreSQL 17+), pages changed by hint bits count as changed pages in the next one.
Logical replication doesn't ship full-page images (it decodes row changes, not pages), so a logical subscriber doesn't see the burst; the publisher still writes it.
Paying it at load time instead
You can't avoid setting the hint bits. You can choose when it happens, so it lands right after the load, inside the job that did the load, instead of on whoever reads first.
VACUUM right after the load, before the checkpoint
This was the cheapest option we measured. Run straight after the load, before a checkpoint, VACUUM took 435 ms and wrote 4 MB of WAL (visibility map and freeze records). It set the hint bits on every page and marked every page all-visible, so the first count(*) after the next checkpoint wrote 2.8 kB and took 155 ms. As a bonus, all-visible pages let index-only scans skip the heap.
Order matters. The same VACUUM run after a checkpoint had to touch pages not logged since, so it wrote 503 MB of WAL itself. That's still better than leaving it to a user's query (it's a maintenance step you schedule, throttle with vacuum_cost_delay and run before the replicas are busy), but if the load and the VACUUM are in the same script, run them back to back.
COPY FREEZE
FREEZE writes the rows already frozen with their hint bits set, and since PostgreSQL 14 it also marks the pages all-visible and all-frozen in the visibility map. On our table: load 6.1 s (the same as plain COPY), WAL 659 MB (plain COPY: 655 MB), and the first read after a checkpoint wrote 2.5 kB in 181 ms. The visibility map showed all 62,500 pages all-visible and all-frozen straight away; after a plain INSERT it showed none. Frozen pages also never need an anti-wraparound vacuum later, the other bill a big load leaves behind.
The catch is the rule. The table must be created or truncated in the same transaction (otherwise: cannot perform COPY FREEZE because the table was not created or truncated in the current subtransaction), and the rows become visible to other sessions' older snapshots the moment you commit, which bends MVCC for anyone holding one. It fits staging tables, full reloads and fresh partitions, not appends to a live table. INSERT ... SELECT has no FREEZE option; for that path use the VACUUM above.
Plain COPY doesn't help on its own
COPY wrote less WAL during the load than INSERT ... SELECT (655 MB against 842 MB here), but its rows have no hint bits either: the first read after a checkpoint wrote 474 MB, the same as the INSERT case. It's the FREEZE option that does the work, not COPY.
Turning checksums off is not the fix
Create the cluster with --no-data-checksums and the WAL burst is gone. So is the reason checksums exist: finding out that a disk, controller or filesystem silently corrupted a page before your backups copy the corrupted page around. They became the default because the CPU cost is small and silent corruption is very expensive. Keep them on and move the hint bit work to load time.
Checks to run on your own database
To find out whether a read paid this cost, run your report (or the first query after a load) with EXPLAIN (ANALYZE, BUFFERS, WAL) and look for a WAL: line whose fpi is close to records on a statement that only reads. Then see how much of a freshly loaded table is all-visible; low numbers mean the first readers will pay:
For the cluster as a whole, watch the share of WAL that is full-page images. A jump right after load jobs is this effect:
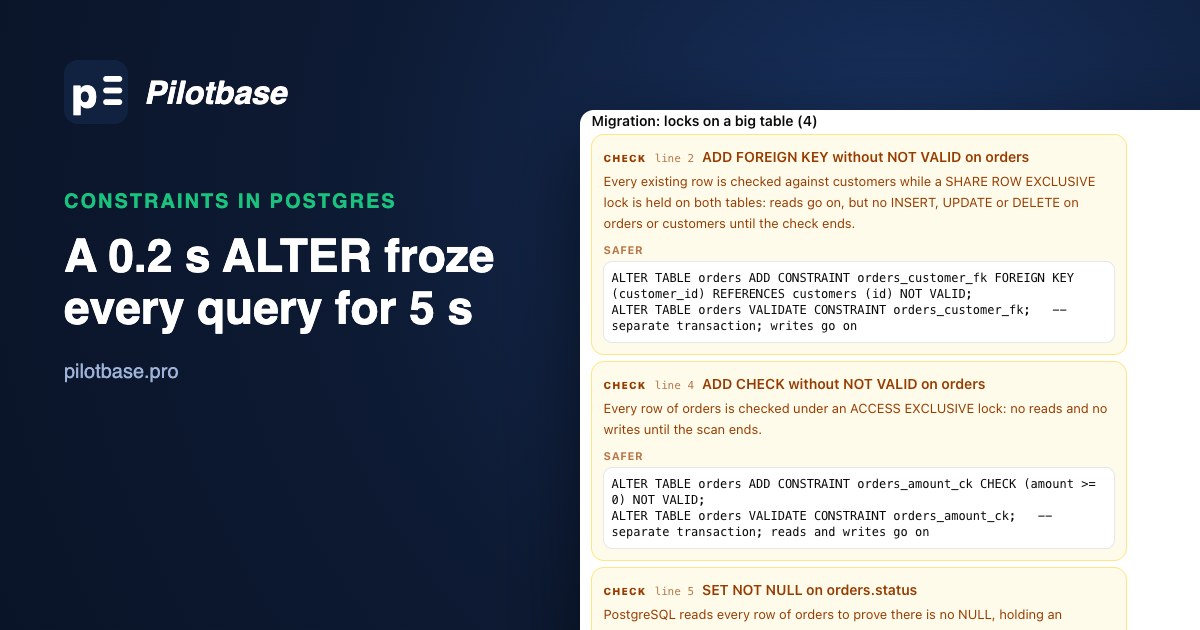
If you load CSVs, the full path is in A messy CSV into Postgres without surprises: profile and clean the file, generate the table, load it. Add the VACUUM (or FREEZE) step at the end. If the same job adds constraints to a big table, adding NOT NULL, a foreign key or a check without a long lock covers that part.
Run the load, the VACUUM and the EXPLAIN (ANALYZE, WAL) checks in Pilotbase, with the plan one click away. Desktop for Windows, macOS and Linux, or Docker on a server.
Get PilotbaseSources
PostgreSQL 18 release notes: initdb enables data checksums by default, and the WAL buffers full count in EXPLAIN. PostgreSQL documentation: wal_log_hints and wal_compression, COPY ... FREEZE, EXPLAIN options, pg_visibility. PostgreSQL wiki: Hint Bits. All numbers are from our own runs on PostgreSQL 18.6; your rows, table size and hardware will give different absolute numbers and the same shape.
Comments (0)
Loading comments…