ERROR: deadlock detected usually shows up in an app's error tracker with almost nothing attached: two process numbers, two transaction IDs and "See server log for query details". It happens a few times a day, never when you're looking, and retrying the request makes it go away, so it gets ignored until the day it happens a few hundred times an hour.
A deadlock is always the same thing: two transactions, each holding a lock the other one needs. Postgres notices, kills one of them and lets the other finish. The fix is nearly always to make every transaction take its locks in the same order. Below we reproduce three deadlocks on PostgreSQL 18 (two transfers, a batch upsert and a foreign key), read the log entries line by line, catch one live from a third session, and measure the two fixes that matter: lock order and a retry on SQLSTATE 40P01. MySQL's version of the same deadlock is at the end.
Turn on the logging first
The client only gets part of the story. The server log gets both statements, but only if it's told to log lock trouble. Two settings, both safe to change with a reload:
deadlock_timeout is how long a session waits for a lock before it checks whether it's in a deadlock. The check isn't free, so Postgres doesn't run it on every wait, only on the ones that last this long. With log_lock_waits on, every wait that passes that same threshold is logged too, deadlock or not. That second part is what usually finds the problem before it turns into deadlocks: a log full of "still waiting" lines on the same table.
Deadlock 1: two transfers in opposite order
A locks row 1, B locks row 2, then each wants the other's row. One second after A started waiting, its deadlock check found the cycle and A got the error. B's update went through and committed. Here's what A's client received:
And here's the server log for the same moment:
Reading it
ShareLock on transaction 16415140. Postgres doesn't keep a lock table entry per locked row. A row lock lives in the row itself (its xmax holds the locking transaction's ID), so to wait for a row, a session waits for the transaction holding it to end, by asking for a share lock on that transaction's ID. When you see "ShareLock on transaction", read it as "waiting for a row someone else has locked".
The DETAIL block is the cycle. One line per process in it: 7596 waits for 7598, 7598 waits for 7596. With three or more sessions involved, there are more lines and the cycle is longer, but it always closes.
The statements listed are the ones that were waiting, not the ones that took the locks. Process 7596's line says UPDATE ... WHERE id = 2, but the lock it held, on row 1, was taken by the statement before it, which the log doesn't show. To get the whole picture you need the transaction, not the statement: find these two statements in your code and look at what ran before them in the same transaction. Setting application_name per code path, or adding %a to log_line_prefix, makes that much quicker.
CONTEXT: while updating tuple (0,2) is the physical address of the row it wanted: page 0, item 2 of accounts. Useful in a pinch (SELECT * FROM accounts WHERE ctid = '(0,2)') if it hasn't been updated since.
Which one dies. The session whose deadlock check runs first is the one that gets the error: normally the one that started waiting first. It's not chosen by cost or age, so you can't rely on the "important" transaction surviving.
Catching one live
Deadlocks are over in a second, but the same view works for any pile-up of waiting sessions, and those last longer. We reran the transfers with deadlock_timeout raised to 10 s for the two sessions, so they stayed stuck long enough to look at:
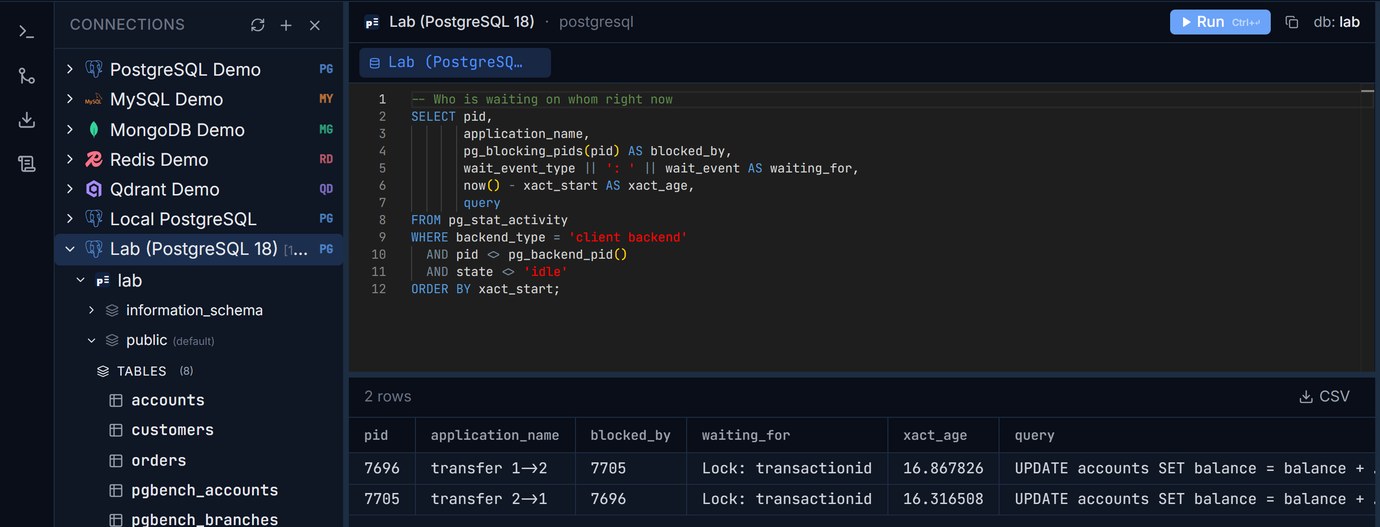
pg_blocking_pids() does the hard part: each session lists the other as its blocker, which is a cycle you can see without reading pg_locks. For the lower-level view, pg_locks shows what each process holds and wants:
Each session holds an exclusive lock on its own transaction ID (every transaction does) and a tuple lock on the row it's queued for, and wants a share lock on the other's transaction ID (granted = f). That's the cycle again, in the raw. If you only ever look at one of these two views, make it the pg_blocking_pids() one.
For a pile-up that isn't a deadlock, the same log_lock_waits setting writes a pair of lines you can grep for:
Fix 1: take locks in the same order everywhere
If every transaction locks rows in the same order, a cycle can't form: whoever gets the first row first gets all of them, and the other waits rather than deadlocks. For the transfer, lock both rows up front, sorted by id, then do the updates in whatever order the business logic wants:
The same two opposite transfers, with this added: no error, both committed in 2.0 s (the second simply waited for the first). ORDER BY matters here: FOR UPDATE locks rows in the order the query returns them, and without ORDER BY that order is whatever the plan produces.
Under load the difference is large. We ran 8 threads doing 300 random transfers each between the same 5 accounts (deliberately hot rows), with a retry on deadlock, first updating in the order given and then with the ORDER BY id FOR UPDATE step:
Same work, 12 times faster, and 13 transfers that a real app would have had to report as failed. The retries hid the deadlocks from users but not their cost: each one meant waiting out deadlock_timeout (100 ms in this test), rolling back and starting over.
The same rule for batch upserts
Two jobs upserting the same keys in a different order deadlock just like the transfers, this time on the unique index:
Fix: one statement per batch with the keys sorted, so every batch walks the index in the same order. Both runs then committed and each tag ended with uses = 2:
The foreign key one
This is the deadlock that surprises people because neither transaction seems to touch the other's rows:
Inserting a child row makes Postgres check the foreign key, and it does that by taking a FOR KEY SHARE lock on the parent row so nobody can delete it or change its key mid-transaction. Both sessions hold that shared lock on customer 7. Then each asks for FOR UPDATE on the same row, which conflicts with the other's share lock. Cycle.
Two fixes, both measured. If what you really want is to update the customer (a counter, a timestamp), just UPDATE it: a plain update of non-key columns takes FOR NO KEY UPDATE, which doesn't conflict with FOR KEY SHARE, so the second session waits instead of deadlocking and order_count ended at 2. If you do need the parent locked, lock it first, before inserting the child: both sessions then queue on the parent and both orders went in. The general rule is the same as before: parent before child, everywhere.
Fix 2: smaller transactions
The longer a transaction holds a lock, the more chances another one has to come along in the wrong order. Our transfers slept for a second between the two updates, which is the test's stand-in for an app that makes an HTTP call, renders a template or waits on a queue in the middle of a transaction. Do that work before BEGIN or after COMMIT. Sessions that sit idle in transaction are the extreme case, and idle_in_transaction_session_timeout puts a ceiling on them.
Fix 3: retry on 40P01, the whole transaction
Even with consistent ordering, a deadlock can happen somewhere you didn't think of, and the right response is to run the whole transaction again. The SQLSTATE for a deadlock is 40P01; retry 40001 (serialization failure) the same way if you use REPEATABLE READ or SERIALIZABLE. The transaction is already rolled back when you get the error, so retry from BEGIN, never from the failed statement. This is the pattern we used for the test above (psycopg2):
Keep the retry count small and add jitter, so two transactions that just collided don't collide again on the next try. And log every retry: a retry that's needed once a week is fine, one that's needed a hundred times an hour is a lock order bug the retry is hiding.
MySQL does it differently
We ran the same two transfers on MySQL 8.4.10 (InnoDB, default settings). The second session got the error the moment its statement would have waited, with no one-second delay: innodb_deadlock_detect is on by default and checks on every wait.
Note the SQLSTATE: 40001, not 40P01, so retry code shared between the two engines should check both. MySQL keeps the details of the most recent deadlock only, in SHOW ENGINE INNODB STATUS:
It's more verbose but says more than Postgres's log: the locks each transaction holds as well as the one it waits for, the index, and the key values (in hex: 80000001 is the int 1). It also shows only the last deadlock, overwritten by the next one; set innodb_print_all_deadlocks = ON to write every one to the error log. InnoDB picks the victim by size (the transaction that has changed the fewest rows), not by who waited first. And InnoDB locks index ranges as well as rows in its default REPEATABLE READ level (gap and next-key locks), so on MySQL two inserts into nearby key ranges can deadlock even when they never touch the same row; the lock-order rule still applies, with ranges counted.
A checklist
When deadlock detected shows up: turn on log_lock_waits, find the two statements in the server log, then find the transactions they belong to in your code and write down the order each takes its locks in (including foreign key checks on parent rows). Make the orders match, usually by locking all the rows up front with ORDER BY id FOR UPDATE, or by sorting batches by key. Move slow work out of the transaction. Then keep a retry on 40P01 and 40001 and log when it fires.
Two related reads on this site: adding a constraint without a long lock for the other kind of lock trouble (DDL behind a long query, every session queued behind it), and pg_stat_statements for finding statements whose mean time is mostly lock waiting.
Keep the pg_stat_activity and pg_locks queries next to your connections in Pilotbase, for PostgreSQL and MySQL in one app. Desktop for Windows, macOS and Linux, or Docker on a server.
Get PilotbaseSources
PostgreSQL documentation: explicit locking and deadlocks, row-level lock modes (FOR KEY SHARE, FOR NO KEY UPDATE), deadlock_timeout and log_lock_waits, pg_locks, SQLSTATE codes. MySQL 8.4 reference manual: deadlocks in InnoDB and deadlock detection. All logs and numbers are from our own runs on PostgreSQL 18.6 and MySQL 8.4.10 in docker.
Comments (0)
Loading comments…