Every index is a promise to do extra work on every write. Most were worth it when someone added them: a customer page, an admin filter, a sync job. Then the page got rewritten, the filter moved to a search service, the job was deleted, and the index stayed. Nobody removes an index for the same reason nobody removes a fire extinguisher: it's hard to prove it will never be needed.
This article makes that proof as concrete as it gets. We built a 2 million row orders table with the eight indexes a few years of feature work tends to leave behind, ran an app workload on the primary and a reporting workload on a streaming replica, and then used Postgres's own counters to find what nobody reads. Then we measured what the dead weight costs, walked into the trap that makes people afraid of this job, and dropped the indexes without blocking the app.
The table and its eight indexes
The last line is not a joke. Postgres happily creates a second identical index if you don't name it; it calls the copy orders_created_at_idx1. Two migration tools, or one migration run against a database that was patched by hand, and you have it. With the primary key and the unique constraint that makes eight indexes: 323 MB of index for 200 MB of table.
The app runs five statements per transaction from four connections on the primary: the customer's latest 20 orders, a count of their orders, an order by id, an order by order number, and an update that marks one order shipped and sets updated_at. Two more connections run a daily report on the replica: orders and revenue for one day, grouped by status. All of it on PostgreSQL 18.6 with default settings, on one Apple M4 machine, with pgbench driving the load.
Ask Postgres what it scanned
Every index has a row in pg_stat_user_indexes. idx_scan counts the scans that started on it and last_idx_scan (PostgreSQL 16 and later) says when the last one was. The query below lists the indexes with no scans, biggest first, and leaves out the ones that enforce something: a primary key, unique or exclusion constraint does its job on every insert even when no query ever reads through it, and dropping it changes what data the table accepts.
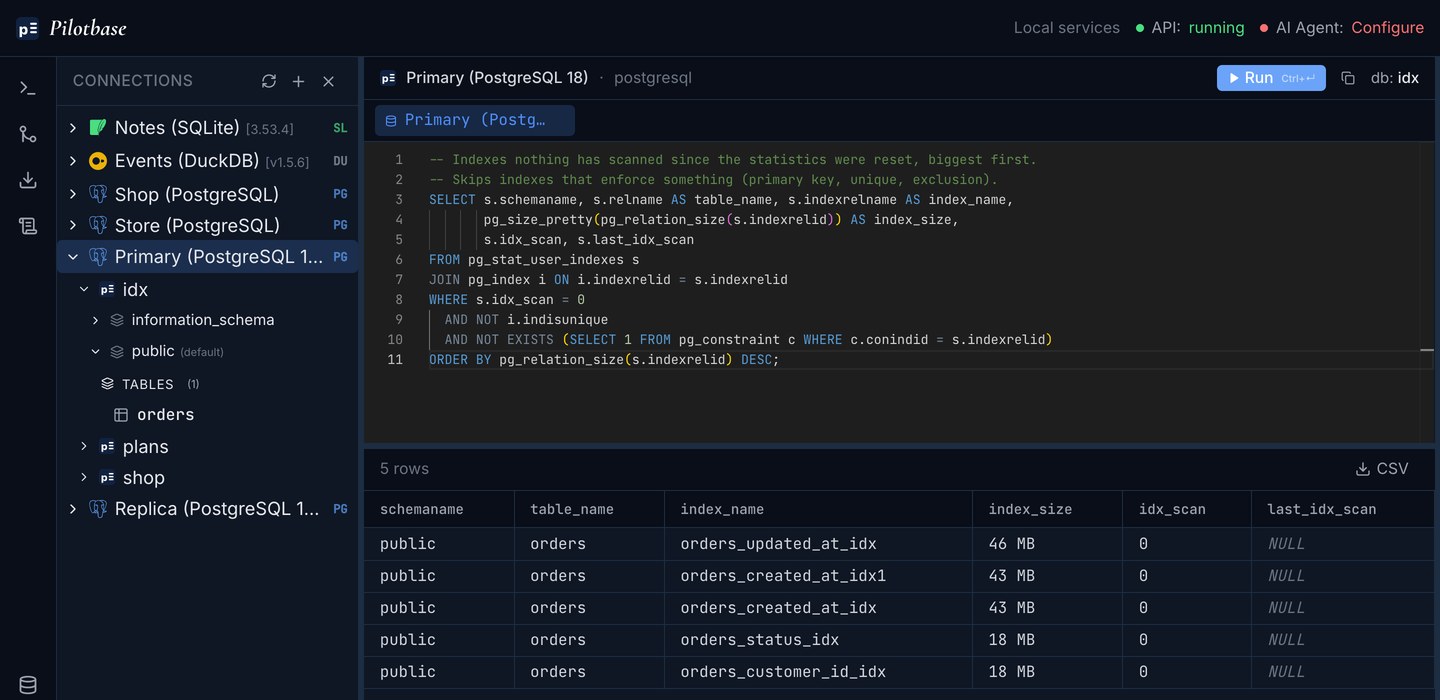
Five indexes and 168 MB that the app never touched. Three are the obvious leftovers: status, updated_at, and customer_id, which the planner ignored because the two-column index on (customer_id, created_at) serves the same lookups. The other two are the created_at pair. On the primary nobody filters by date, so both look dead.
Now ask the replica
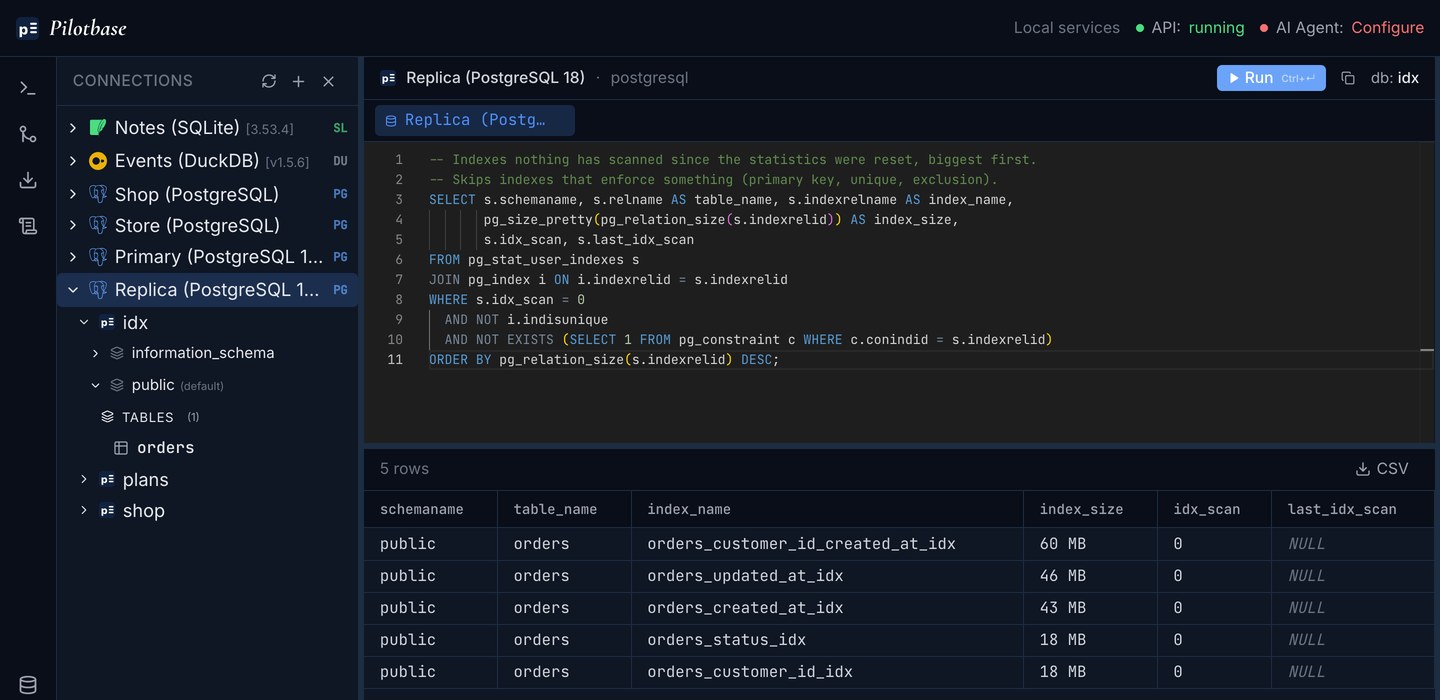
Statistics are kept per server. A streaming replica has its own counters, and they count the queries that ran on the replica, not the ones on the primary. Here the reporting workload used orders_created_at_idx1 285,223 times in a one-minute run, while the primary reported zero for it. And the composite index the primary relies on shows up as unused on the replica, because nobody runs the customer page there.
If you had run the query on the primary only and dropped everything it listed, the next report on the replica would have read 2 million rows instead of one day's worth. This is the trap behind most "we dropped an unused index and production fell over" stories, and it's not limited to replicas. An index is only unused if it's unused on every server that could run a query against it: the primary, each replica that serves reads, and whichever replica you'd fail over to, since it becomes the primary with its own counters.
Notice the other thing the replica did. Faced with two identical indexes, the planner picked one and used it every time, so the copy it didn't pick looks unused while the one it did pick doesn't. That is the normal pattern for exact duplicates: one gets everything, one gets nothing, and it's an accident which is which.
Find duplicates and prefixes
Counters tell you what isn't read. A second query finds indexes that can't be needed whatever the counters say, because another index on the same table covers them: the same columns in the same order with the same operator classes, collations, expressions and WHERE clause (an exact duplicate), or the leading columns of a wider B-tree (a prefix).
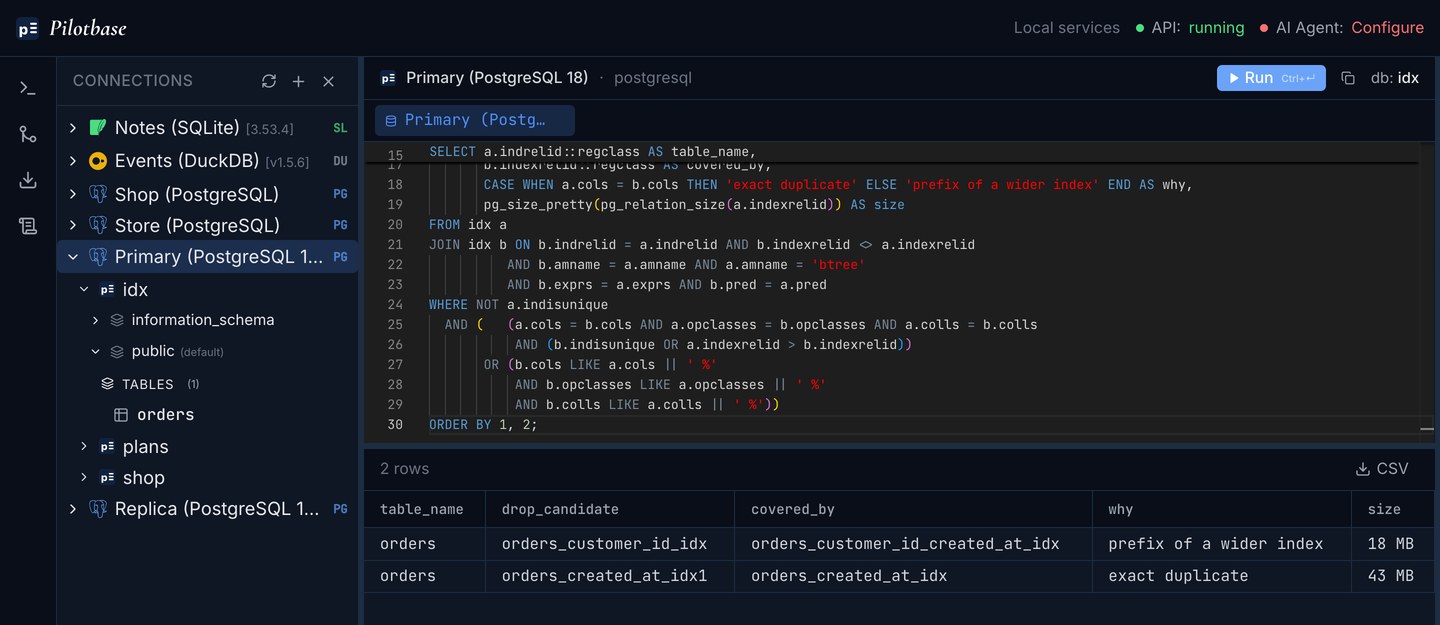
Two remarks on reading it. For an exact duplicate the query suggests the newer one, and either can go: the planner will switch to the survivor without being told, as it would have on our replica. Check first that nothing refers to the name you're dropping, such as ALTER TABLE ... REPLICA IDENTITY USING INDEX, CLUSTER ... USING, or a planner hint. And a prefix is only redundant for B-tree indexes, where the wider index is sorted by the same leading columns; an index on (a) is not covered by one on (b, a). The wider index is bigger to scan, which rarely matters for equality lookups; on our table the planner had already chosen the composite for every customer_id query.
Collation and operator class count. An index built with text_pattern_ops or COLLATE "C" next to a plain one on the same column is not a duplicate: it serves different queries, LIKE 'abc%' among them. The query compares both, so it won't list those pairs. (Why you might have such an index is in Sorting text in Postgres is slow.)
What the dead weight costs
We ran the same workloads twice on a freshly built table: once with all eight indexes, once with only the four the workload uses (primary key, unique order_no, (customer_id, created_at), and one created_at). Index size went from 323 MB to 206 MB. The app workload ran three times for 60 seconds each in a row, without forcing checkpoints:
About 1.6 times the throughput and a sixth of the WAL, from deleting indexes nobody read. Most of it comes from a single effect, and it's the reason an unused index on a column you update costs far more than its size.
Postgres can update a row without touching any index if none of the indexed columns changed and the new version fits on the same page. That's a HOT (heap-only tuple) update. The app's update changes status and updated_at. With an index on either one, no update can be HOT: every update writes a new entry into all eight indexes, including the six whose columns didn't change. Drop the two unused indexes on those columns and 80% of the updates touch no index at all. The other 20% didn't find room on their page; a lower fillfactor on the table raises that share.
WAL is where the cost shows up next. More index pages dirtied means more full-page images after each checkpoint, more WAL, and checkpoints that come four or five times a minute instead of once, because the default max_wal_size of 1 GB fills sooner. Replicas replay all of it, and backups and archives store all of it.
Inserts pay less, because they have to add an entry to every index anyway, and each extra index is one more: a batch of 1,000 inserted rows took 14.4 ms with eight indexes and 8.1 ms with four, and single-row inserts from four connections went from 24,183 to 29,109 per second. The read queries used the same indexes in both runs, which is the point: the ones we dropped weren't helping any of them.
Before you drop: is the window long enough?
A zero only means something over a long enough stretch of time. Look at when the counters started:
Counters start again from zero after pg_stat_reset(), after a crash or an immediate shutdown, when a server starts from a base backup or point-in-time recovery, and after a major-version upgrade with pg_upgrade, which carries planner statistics over but not these. A replica promoted last week has a week of history. If the window doesn't cover a whole business cycle, the month-end close, the quarterly export, the yearly cleanup that deletes old customers and needs the index on orders.customer_id to find their orders, wait or ask whoever runs those jobs.
If you want an answer without waiting, the HypoPG extension can hide a real index from the planner in your session (hypopg_hide_index()), so you can run EXPLAIN on the queries you worry about and see the plan they would get without it. It changes nothing for other sessions.
Drop it without blocking the app
Save the definition first, so that putting it back is one statement and not an archaeology project:
A plain DROP INDEX takes an ACCESS EXCLUSIVE lock on the table. It has to wait for every transaction that has touched the table, and while it waits, every new query on the table queues behind it. With a 15-second report open on the table, ours sat there until lock_timeout cancelled it:
DROP INDEX CONCURRENTLY takes a weaker lock, so reads and writes carry on while it waits for the transactions that might still be using the index. Behind the same 15-second report it waited 9.6 seconds, and an insert into the table during that wait took 36 ms. The restrictions are in the documentation: one index per statement, not inside a transaction block (so not inside most migration tools' default transaction), no CASCADE, and not for indexes behind a unique or primary key constraint or on partitioned tables.
One thing the documentation doesn't spell out, and that we saw happen: if a concurrent drop is cancelled partway, by lock_timeout, a deploy timeout or Ctrl-C, the index stays behind marked invalid:
In that state (indisvalid false, indisready still true) queries no longer use it but every write still updates it, so the cost stays and the benefit is gone. Run the drop again. A migration that drops indexes concurrently should check for invalid leftovers when it finishes:
Then watch for a week. If something slows down that you didn't expect, the definition you saved goes back with CREATE INDEX CONCURRENTLY, which also doesn't block writes. If you compare schemas before each deploy, Schema diffs before a deploy shows how to catch an index that went missing, or appeared twice, between staging and production.
The short version
Run the unused-index query on every server that takes queries, and only consider indexes that show zero on all of them. Check that the counters cover a full business cycle. Run the duplicate query, which needs no history at all. Leave unique and primary key indexes alone. Pay special attention to unused indexes on columns your app updates, because they cost far more than their size: on our table, two of them turned every update into eight index writes. Save each definition, drop with CONCURRENTLY and a lock_timeout, check for invalid leftovers, and keep the CREATE INDEX statement handy for a week.
Pilotbase keeps a connection to each server side by side, so you can run the same index query on the primary and on every replica and compare the lists before you drop anything. Desktop for Windows, macOS and Linux, or Docker on a server.
Get PilotbaseSources: PostgreSQL 18 documentation, The Cumulative Statistics System (pg_stat_all_indexes, what resets the counters, statistics on replicas), DROP INDEX (CONCURRENTLY and its restrictions), Heap-Only Tuples (when an update can skip the indexes), pg_upgrade (which statistics it carries over); HypoPG README (hiding indexes). Every number, plan and screenshot is from our own run: PostgreSQL 18.6 on an Apple M4 with default settings (shared_buffers 128 MB, max_wal_size 1 GB), a streaming replica on the same machine, pgbench with 4 connections on the primary and 2 on the replica, queries run in Pilotbase.
Comments (0)
Loading comments…