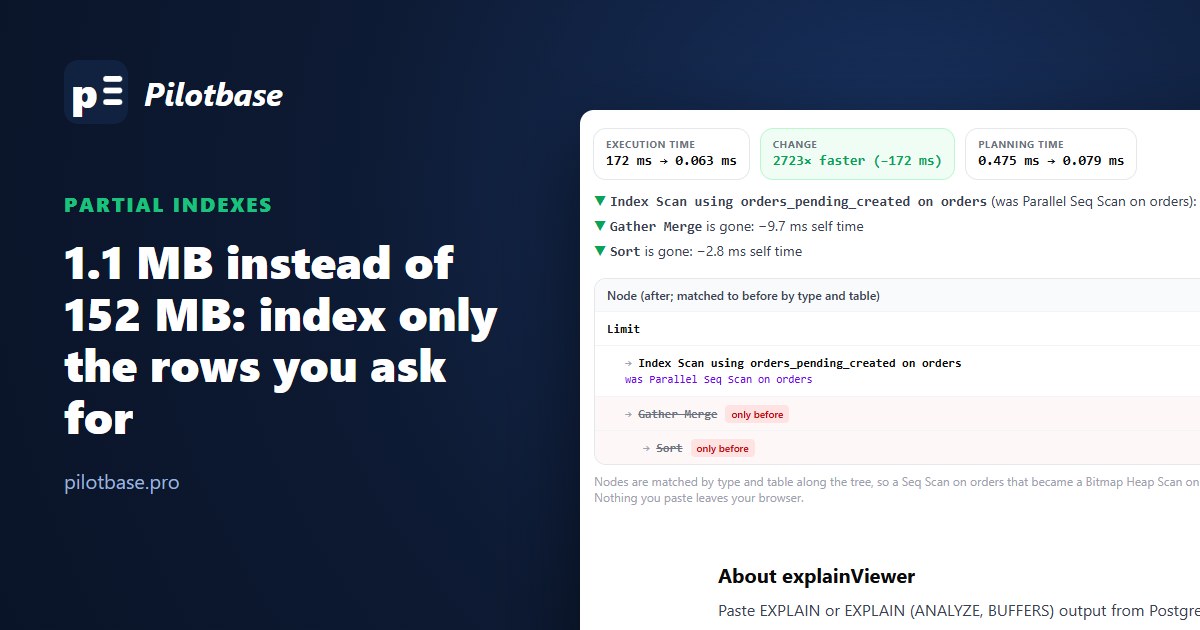
Most tables that drive a queue look the same: millions of rows that are done and a thin slice that isn't. Orders waiting to ship, jobs waiting to run, invoices waiting to be paid. The app asks about the thin slice all day, and the index that serves it usually covers every row anyway, because CREATE INDEX ON orders (status, created_at) is what everyone writes first.
A partial index stores only the rows that match a WHERE clause. We built one on PostgreSQL 18 for an orders table with 5 million rows, 1% of them pending, and compared it with the usual full index: size, build time, reads and write cost. Then we went looking for the cases where the planner won't use it, because that's where partial indexes bite. MySQL doesn't have them, so we measured its usual workaround too, and SQLite, which does.
The setup
The query the app runs all day is "the 50 oldest pending orders":
What you save, and what you don't
Read that table carefully, because it's not the story partial indexes are usually sold with. For the query itself, the partial index was barely faster. A B-tree is shallow either way, and once Postgres has walked down to the first pending entry, both indexes hand back the next 50 rows from the same few pages. 140 MB of the full index were for shipped orders that this query never touches, and never paid for at read time.
The savings are elsewhere: the index is 1/140th the size, so it stays in memory without pushing out anything else; it builds in a third of a second, which matters when you CREATE INDEX CONCURRENTLY on a busy table; and every insert, update and vacuum touches it only for the 1% of rows it holds. Loading a million orders took 2.5 s with the full index and 1.4 s with the partial one. On a write-heavy table with several of these indexes, that's the difference you'll notice.
So the rule of thumb: a partial index is worth it when most rows will never match the predicate, the predicate is fixed (a status, a flag, deleted_at IS NULL), and the table is written a lot or memory is tight. If the full index already exists for other queries, keep it and skip the partial one: one index serving everything beats two.
When the planner can't use it
A partial index can only be used when Postgres can prove, at planning time, that the query's WHERE implies the index's WHERE. The proof is simple and literal, and these are the ways it fails. We dropped the full index for these tests so the partial one was the only candidate.
A parameter instead of the value
WHERE status = $1 proves nothing about status = 'pending' until the value is known. With a custom plan (planned with the value in hand), Postgres uses the index. With a generic plan, which is planned once for any value, it can't:
We pasted both plans into explainViewer's compare mode to see the difference node by node:
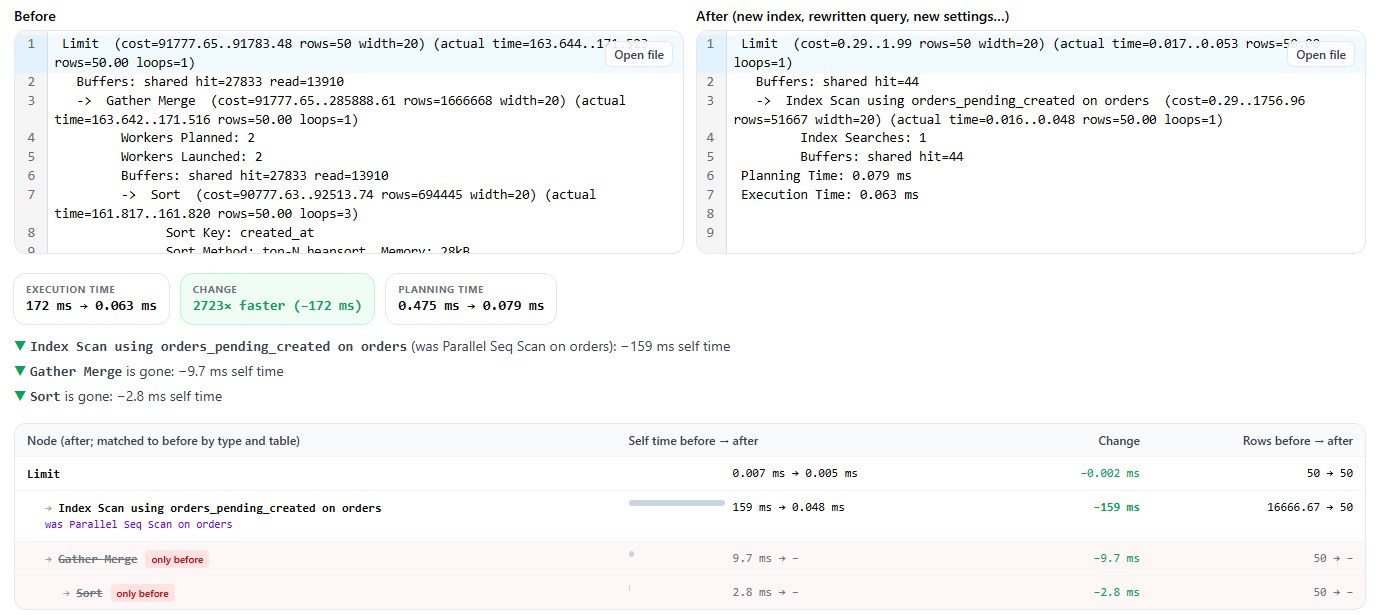
When does this happen for real? Drivers that prepare statements (JDBC after 5 uses, psycopg 3 after 5, named statements in node-postgres) run them through the plan cache, and in the default auto mode Postgres plans the first five executions with the value, then compares a generic plan's estimated cost with the custom ones. Here the generic plan costs far more, so it stayed on custom plans: after 10 executions, pg_prepared_statements showed 11 custom plans and 0 generic ones. You hit the slow plan when someone sets plan_cache_mode = force_generic_plan to save planning time, or when the generic plan happens to look cheap enough. The fix is not to depend on it: write the predicate as a literal and parameterise everything else. This generic plan used the partial index:
In an ORM that means a named scope or a raw fragment for the fixed part (.where("status = 'pending'")), not a bound value.
A predicate that doesn't match
Postgres doesn't reason about what the expressions mean, only whether one implies the other. It does handle simple ranges on the same column: with an index WHERE total > 100, a query with total > 400 used it (400 > 100 proves the row is in the index), and one with total > 50 didn't.
Statistics
Even when it can use the index, the planner still estimates rows from the table's statistics. A partial index doesn't get statistics on the predicate, so if 1% pending becomes 30% after a bad night, plans keep their old guesses until ANALYZE runs. Autovacuum normally takes care of it.
Partial unique indexes: one active row per user
This is where partial indexes do something nothing else can. "Each user can have any number of old subscriptions but only one active one" is a constraint on a subset of rows:
It's race-free, which an application check (SELECT first, then INSERT) is not. Upserting against it has one catch: ON CONFLICT has to repeat the index's WHERE, or Postgres can't match it to the index:
The same pattern covers soft deletes (UNIQUE (email) WHERE deleted_at IS NULL, so a deleted account doesn't block a new sign-up with the same address) and "one default address per customer".
MySQL: no partial indexes, and the workaround has a trap
MySQL 8 has no WHERE on CREATE INDEX. The usual workaround is a functional index on an expression that is NULL for the rows you don't care about. We loaded the same 5 million orders into MySQL 8.4:
It's half the size, not 1/140th: InnoDB stores an entry for every row, NULLs included. And the obvious query against it is a disaster:
On MySQL, use the composite index for reads: an equality on the first column followed by the sort column gives the same few-page lookup a partial index would. Keep the functional trick for the one thing it does well, a unique constraint on a subset, because a unique index allows any number of NULLs:
SQLite has them
SQLite has supported partial indexes since 3.8.0, with the same syntax as Postgres. On the same 5 million rows (SQLite 3.50), the full index built in 10.7 s and the partial one in 1.2 s. With both present, the planner preferred the full one. With only the partial index, it used it for status = 'pending' and, in our test through Python's sqlite3, also for status = ? with 'pending' bound. We didn't dig into why it could prove the predicate there; check your own driver with EXPLAIN QUERY PLAN before relying on that; writing the literal is the safe habit here too.
Checklist
Before adding a partial index: the predicate is fixed and matches a small share of rows; the queries that should use it write the predicate exactly as the index does, as a literal; and no existing index already serves them. After adding it, run the real query with EXPLAIN (ANALYZE, BUFFERS) from the app's own driver, prepared statements included, and compare the plan with the one you had. For constraints on part of a table (one active, one default, unique among non-deleted rows), a partial unique index is the cleanest tool Postgres has.
Paste two EXPLAIN (ANALYZE, BUFFERS) outputs and see which nodes changed and by how much. Runs in your browser, free.
Open explainViewerRelated on this site: unused and duplicate indexes for finding the full indexes a partial one could replace, and HOT updates for what every extra index costs on update.
Look at pg_stat_user_indexes, index sizes and plans for PostgreSQL, MySQL and SQLite in one app. Pilotbase is free for Windows, macOS and Linux, or Docker on a server.
Get PilotbaseSources
PostgreSQL documentation: partial indexes, plan_cache_mode and generic plans, INSERT ... ON CONFLICT with index_predicate. MySQL 8.4 manual: functional key parts. SQLite: partial indexes. Measured on PostgreSQL 18.6 and MySQL 8.4.10 (Docker images) and SQLite 3.50.4, October 2026.
Comments (0)
Loading comments…