Most databases don't fail suddenly. A table grows a little faster each week, an int key creeps towards 2,147,483,647, dead rows pile up behind a vacuum that can't keep up, and nobody looks until an insert fails. The numbers that would have warned you are all in the catalog, but the catalog only tells you about now. It doesn't tell you what the table looked like last Tuesday.
So keep last Tuesday. One table, one row per table per day, filled by one scheduled query inside the database: pg_cron on PostgreSQL, the event scheduler on MySQL. No agent, no monitoring service. Then growth, runway and "something changed" become plain SQL over your own history. We built it on PostgreSQL 18.6 and MySQL 8.4.11 and ran a shop database through a busy week to see what the history shows, and what it gets wrong.
The lab: a week of a growing shop, on both engines
Same schema and the same daily writes on both engines: orders with an int key that starts at 2,100,000,000 (an app a few years old, already 97.8% through its key range), events with a 3-day retention delete, sessions with 50,000 rows each rewritten 4 times a day, and customers. Each day added more orders than the last, from 300,000 on day one to 540,000 on day seven, with yesterday's orders updated to shipped. Every day also wrote 600,000 events and, from the fifth day on, deleted the oldest day of them.
A real week takes a week, so we compressed it: each "day" ran its writes, waited 75 seconds so autovacuum could do what it would do between busy hours, then called the same snapshot procedure the scheduler calls, with that day's date. Separately, both schedulers ran the snapshot every minute for a few minutes to show they really fire (below). Dates are 23 to 30 October 2026; the 23rd is the state before the week.
The snapshot table and the function that fills it (PostgreSQL)
Sizes come from pg_relation_size and pg_indexes_size (exact, read from the files), row and dead-row counts from pg_stat_user_tables (estimates kept by the statistics system), and key use from the sequence behind each serial or identity column, found through pg_depend. The upper limit comes from the column's type, not the sequence: a sequence created as bigint feeding an int column still fails at 2,147,483,647.
on conflict ... do update makes it safe to run twice on the same day: a manual run, a retry or a scheduler that fires twice leaves one row per table per day. A database-wide row ((database), from pg_database_size) gives the disk trend.
Scheduling it with pg_cron
pg_cron is a background worker that runs cron-style jobs inside PostgreSQL. It ships with most managed Postgres services (RDS, Cloud SQL, Azure, Supabase and others); self-hosted, it has to be in shared_preload_libraries, so adding it means one restart. It lives in one database per cluster (cron.database_name), and cron.schedule_in_database() runs jobs elsewhere.
We scheduled it every minute ('* * * * *') for a short test: two runs at 06:47:00 and 06:48:00, both succeeded, 13 ms and 7 ms, and still eight rows for that day afterwards because of the upsert. Inside the compressed week, the snapshot took 40 to 53 ms per run on PostgreSQL. Cheap enough to run hourly if you want finer history.
What a week of snapshots shows (PostgreSQL)
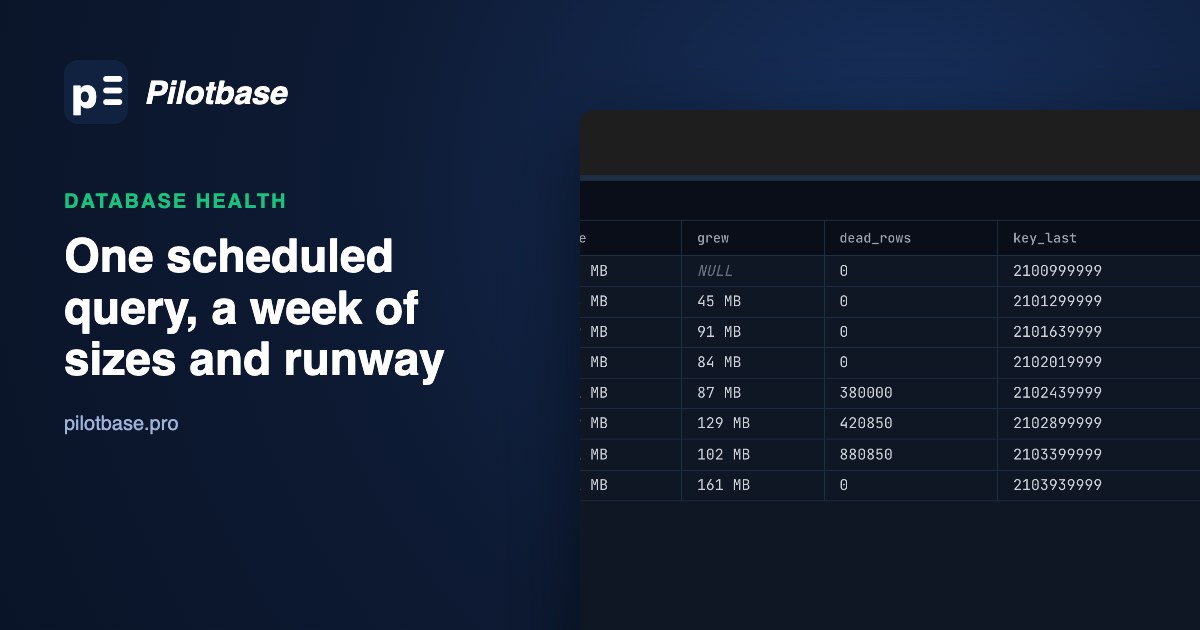
Three patterns you only see with history. orders grew 45 MB on the first day and about twice that from the second day on, with only 13% more new rows. The difference is the update to shipped: in PostgreSQL an update writes a new row version, so a table that updates its rows grows faster than its row count. sessions never gained a row, yet went from 15 MB to 118 MB in three days and then stopped: four rewrites a day settle once autovacuum frees enough space for the next round to reuse. events added 86 MB a day until the retention delete began on the 28th, then slowed to 29 MB on the 30th as new rows moved into the space vacuum freed. If you only ever looked at today's size, all three would just be numbers.
Growth per day is a lag() over the snapshots. Disk runway uses the slope of the last seven days with regr_slope, which is less jumpy than first-minus-last:
Key runway: 98 days, and falling faster than it looks
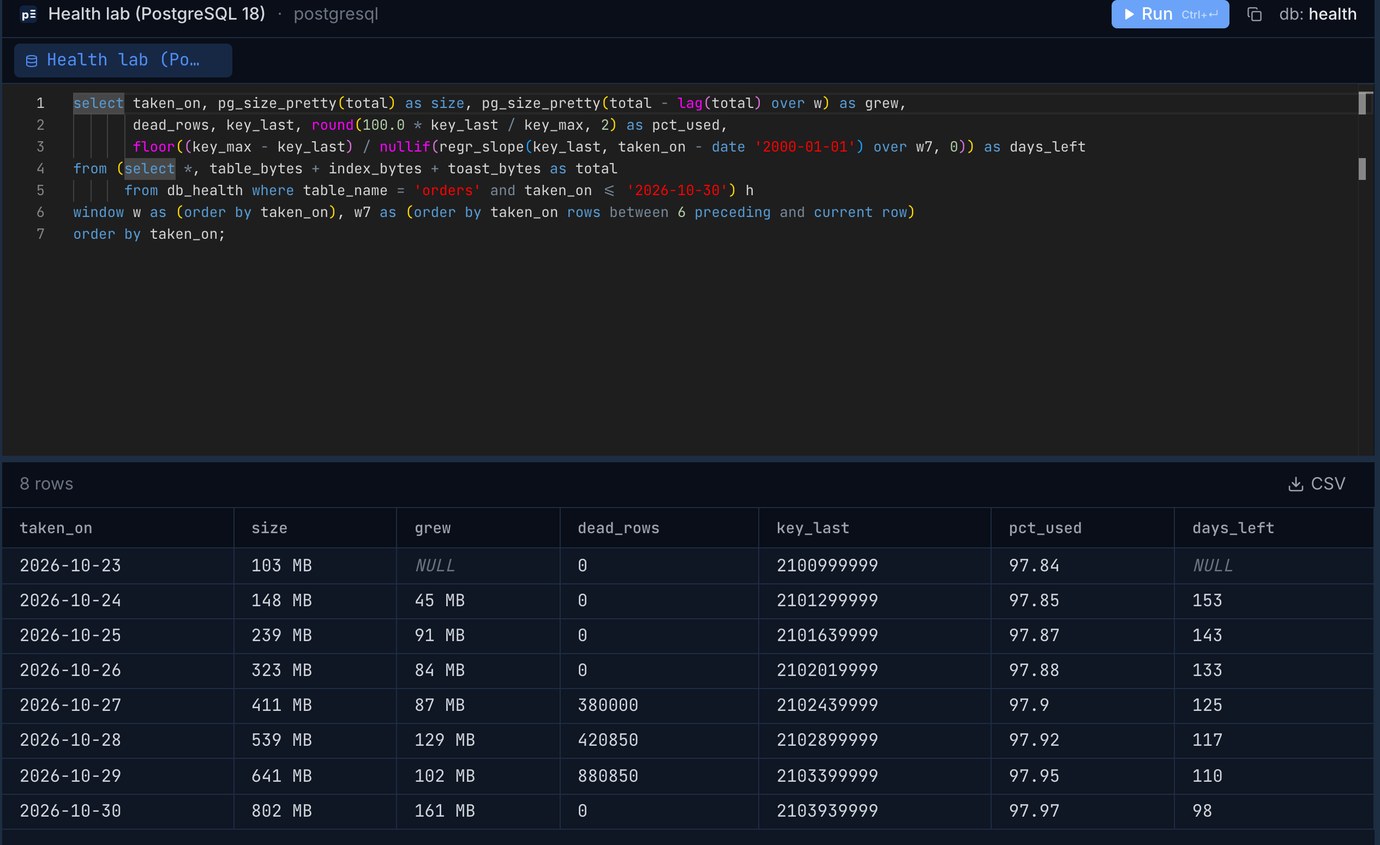
"97.97% used" sounds like an emergency and "98 days left" sounds like next quarter's problem, and the history says both are too comfortable. Computed each day over the days so far, the runway went 153, 143, 133, 125, 117, 110, 98: it lost 55 days in six. The seven-day slope (440,000 ids a day) is an average of a rising line; at the last day's rate of 540,000 the real answer is 43,543,648 / 540,000 = 80 days. For an alert, use the larger of the 7-day slope and the last day's rate. And moving a busy table to bigint takes planning, so alert at 180 days, not at 30. Running out of int covers the migration itself.
Dead rows, and a live-row count that was 29% off
Dead rows are a sawtooth: they build until autovacuum runs, then drop to zero. A single snapshot of 80% dead in sessions means little; 80% on two snapshots in a row means vacuum isn't keeping up. That's how the alert view below treats it.
Look at orders on the 30th: 2,800,186 live rows. The table had 3,940,000. The snapshot ran between autovacuum finishing at 06:40:06 and the automatic analyze at 06:40:40; vacuum had just written its own estimate, built from the 58% of pages it scanned, and analyze corrected it to 3,923,332 a few seconds later. n_live_tup is an estimate, and it can be wrong by a lot for a few seconds or minutes after a vacuum. Use the size columns for trends (they're exact), treat row counts as rough, and if you need true row counts, count(*) the few tables that matter in the same function.
The same thing on MySQL, and the 24-hour trap
MySQL's numbers come from information_schema.TABLES: DATA_LENGTH, INDEX_LENGTH, DATA_FREE (space InnoDB holds but isn't using), TABLE_ROWS and AUTO_INCREMENT. The procedure is the same shape:
The first line of the procedure matters more than anything else in this article. MySQL caches these table statistics, and information_schema_stats_expiry is 86,400 seconds by default: up to a day old. We ran the procedure twice per day, once with the default and once with the setting at 0:
With the default, all eight daily snapshots held the numbers of the first one: the table had grown sixfold and the history showed a flat line. Even AUTO_INCREMENT stayed frozen at the first day's value, so the key runway would never have moved. In a real daily schedule you'd get numbers that are anywhere from fresh to a day old, depending on when something last read them, which is worse than obviously wrong. Set the session to 0 in the procedure. With fresh statistics, TABLE_ROWS was within 2.5% of the true count (InnoDB samples pages for it), and the snapshot took 31 to 68 ms. The test event ran at 06:47:03 and 06:48:03, 7 ms each.
MySQL grew differently, and burned 9% more ids
The same week took 854 MB on MySQL against 1,489 MB on PostgreSQL. InnoDB updates rows in place and keeps old versions in undo logs, so sessions stayed at 13.5 MB through 1.4 million rewrites, and orders didn't double its daily growth when the shipped updates began. Where MySQL shows churn is DATA_FREE: when the retention delete started on the 28th, events stopped growing for a day and the free space in the schema jumped from 22 MB to 86 MB, then new rows filled it on alternate days. Track DATA_FREE the way you track dead rows on PostgreSQL.
The surprise was in the keys. PostgreSQL's identity column used exactly one id per row: 2,940,000 orders in the week, 2,940,000 ids. MySQL used 3,211,215 ids for the same 2,940,000 rows, 9.2% more, and on customers it used 8,191 ids a day for 5,000 rows. This is innodb_autoinc_lock_mode = 2, the default since 8.0: for an INSERT ... SELECT, InnoDB doesn't know how many rows are coming, so it reserves ids in batches of 1, 2, 4, 8 and so on, and the unused end of the last batch is lost. 5,000 rows end inside the 4,096 batch, and 1 + 2 + ... + 4,096 = 8,191. So the runway must be computed from AUTO_INCREMENT, never from max(id) or a row count:
MySQL has no regr_slope, so the MySQL version of the runway query takes the first and last value of the last seven days with first_value() / last_value() over a window; the full query is in our lab files and works on 8.0 and later.
Alerts: a view that is empty when all is well
The history is only useful if someone reads it, and nobody reads a healthy table every morning. Turn the rules into a view that returns rows only when something needs a look, and have whatever already runs on a schedule (a CI job, a cron line in your app, Pilotbase opened on Monday) check whether it's empty:
On the lab's last day, with the runway threshold at 90 days, the view returned one row: events | dead rows 33% two days running, the retention delete outpacing vacuum on a table that had just started deleting. With the threshold at 180, orders joins it. That's the right pair of warnings for this database: one for next week, one for next quarter.
What it costs to keep
One row per table per day. Our rows averaged 101 bytes, so a database with 200 tables adds 73,000 rows, around 10 MB with the primary key, per year. Keep it forever; the trend over a year is the most useful thing in it. The two scheduler logs need trimming (cron.job_run_details grows by one row per run and is never cleaned automatically), and on managed services check that the scheduler is on: on self-hosted MySQL 8.4 event_scheduler was ON by default; pg_cron needs the preload line and a restart once.
If the table you are watching runs out of runway, Running out of int: finding id columns near 2,147,483,647 and moving them to bigint is the fix; if dead rows stay high, Autovacuum falling behind is the tuning.
Open db_health next to your tables, run the runway and alert queries and keep them as saved snippets, on PostgreSQL, MySQL and more. Pilotbase is free for Windows, macOS and Linux, or Docker on a server.
Get PilotbasePlanning the int-to-bigint change the runway warned you about? Paste the ALTER into sqlInspector to see which statements rewrite or lock the table on PostgreSQL and MySQL.
Open sqlInspectorSources: pg_cron README (version 1.6: cron.schedule, cron.job_run_details not cleaned automatically, cron.timezone default GMT, one database per cluster); PostgreSQL 18 database object size functions, pg_stat_user_tables and aggregate functions (regr_slope); MySQL 8.4 information_schema_stats_expiry, the TABLES table, Event Scheduler configuration and AUTO_INCREMENT handling in InnoDB (lock mode 2, gaps for bulk inserts). Our test: PostgreSQL 18.6 with pg_cron 1.6 and MySQL 8.4.11 (defaults: event_scheduler ON, information_schema_stats_expiry 86400, innodb_autoinc_lock_mode 2) on an Apple-silicon Mac mini, October 2026; a compressed week of 7 days, scripts reproducible.