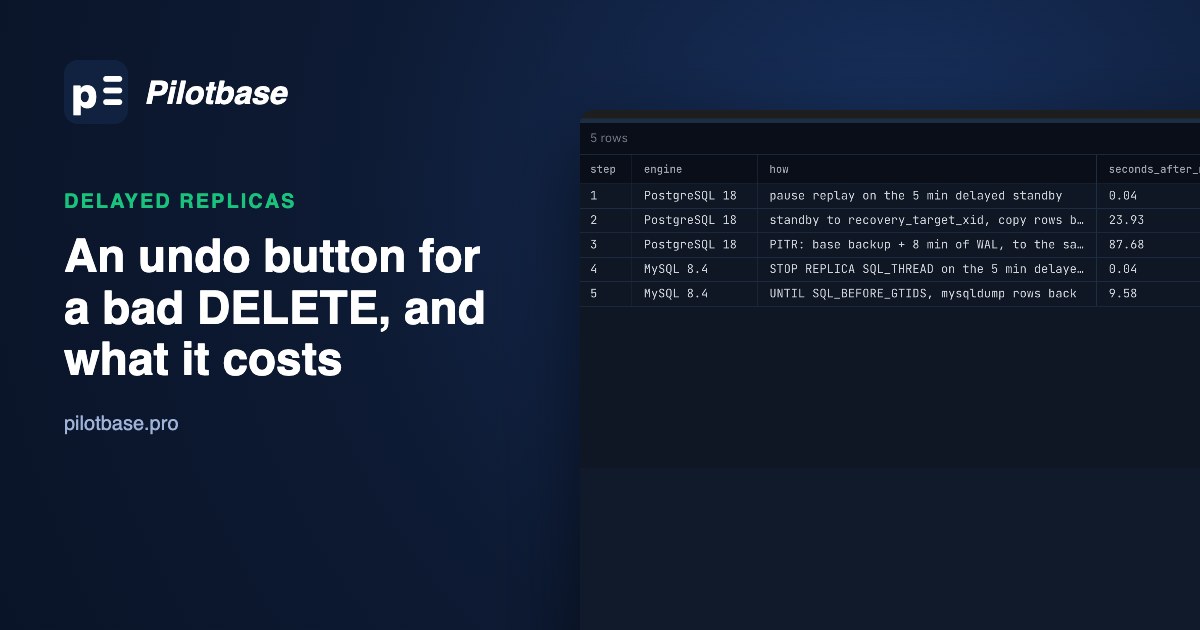
Someone runs DELETE FROM orders; on production. The WHERE clause was on the next line of their editor and didn't make it into the selection. Your streaming replica deleted the same million rows a few milliseconds later, because copying every change at once is its job. Your backups can bring the rows back, but only after a restore and a replay of every write since last night.
A delayed replica sits between those two. It receives every change immediately, like any standby, but applies it only after a fixed delay, so for that long it still shows the database as it was before the mistake. PostgreSQL calls the setting recovery_min_apply_delay; MySQL calls it SOURCE_DELAY. We set both to 5 minutes, ran the bad DELETE under a steady write load, and timed how long each way of getting the rows back took. Then we measured what the delay costs: disk for the WAL it holds, and vacuum on the primary.
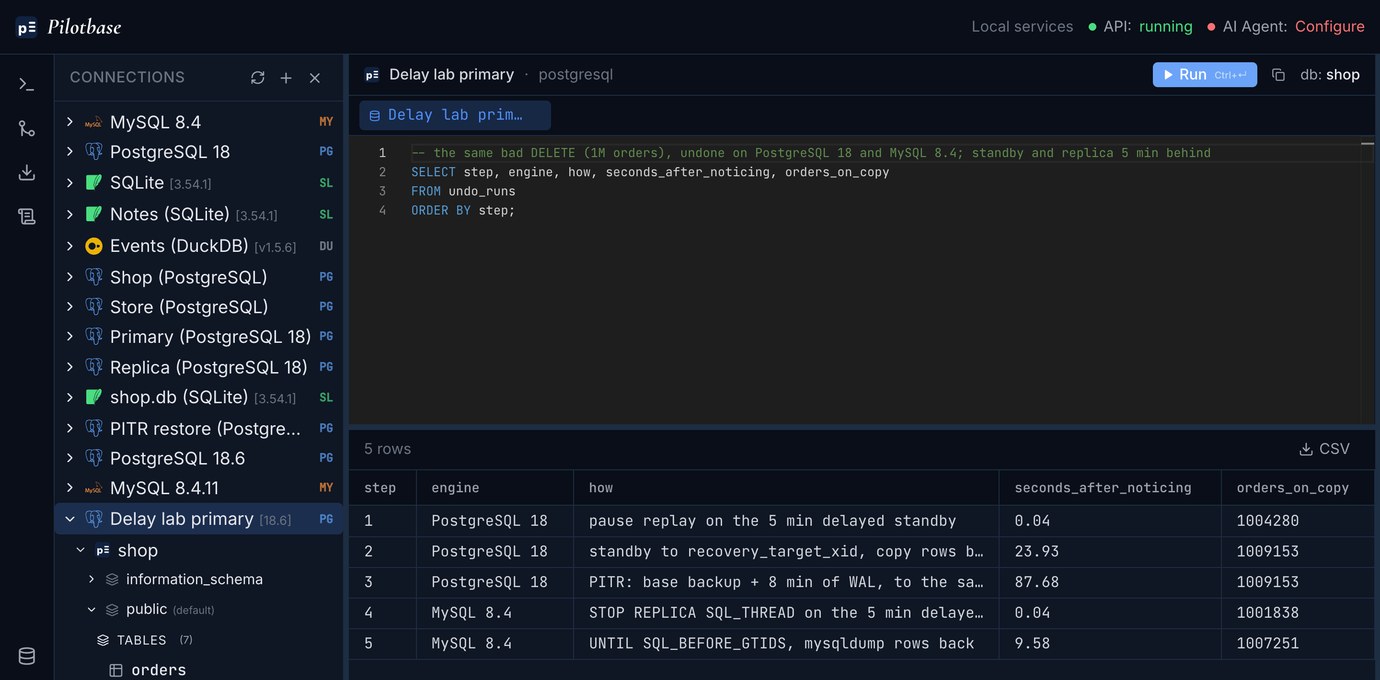
The PITR row is the flattering case for PITR: its base backup was only 8 minutes old. With a nightly backup 12 hours behind, the same replay speed and this lab's write rate would put it past 69 minutes. The delayed standby's time doesn't depend on when the last backup ran.
Setting one up in PostgreSQL
A delayed standby is an ordinary streaming standby with one more setting. Use a replication slot, so the primary keeps WAL for it if it disconnects:
The delay is counted from each transaction's commit time on the primary. Only commit records wait: WAL arrives and is written to the standby's disk as fast as it comes, so the delay doesn't mean you lose data if the primary dies. The setting can be changed with a reload. Two things in the documentation are worth knowing before you choose a value: the standby's clock should agree with the primary's, and a standby with a delay shouldn't be a synchronous standby with synchronous_commit = remote_apply, because every commit on the primary would wait out the delay.
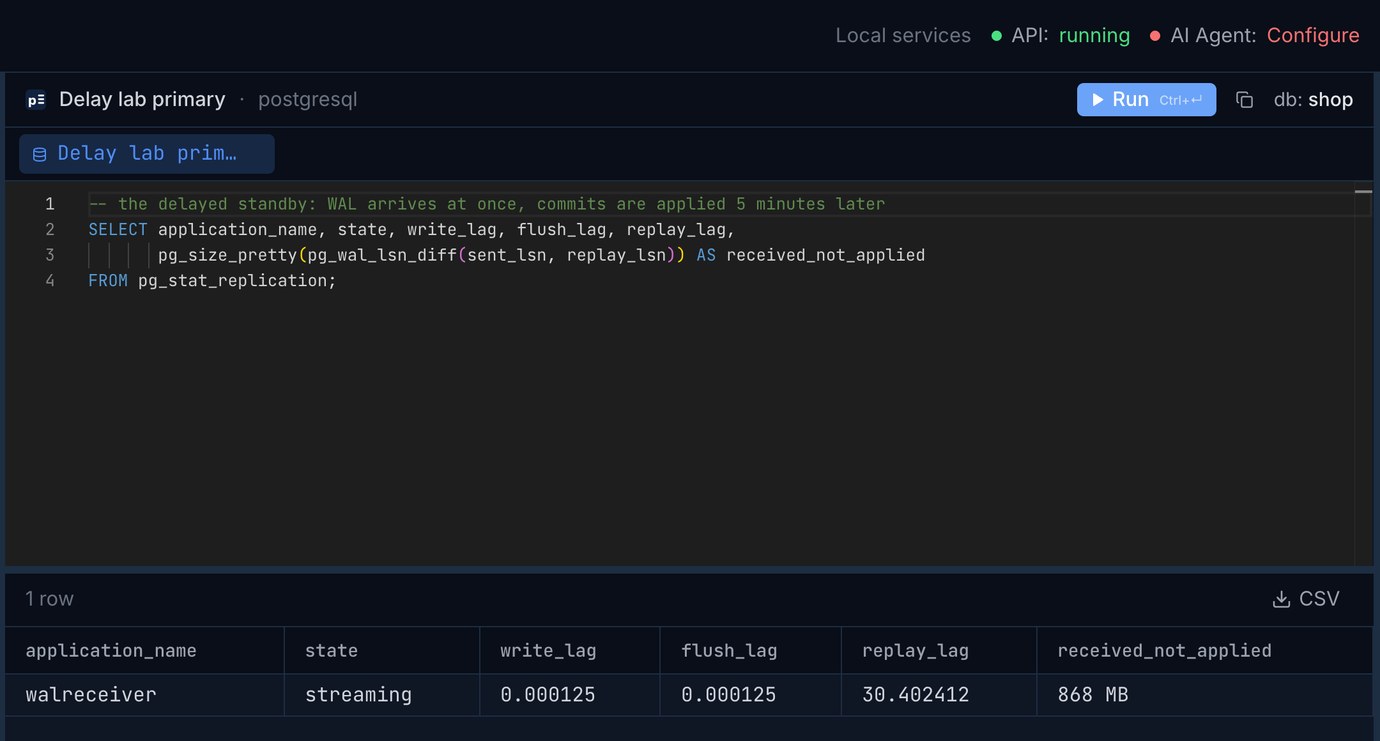
On the primary, pg_stat_replication shows the shape of it: write and flush lag in microseconds, and close to 900 MB of WAL that has arrived but isn't applied yet. The replay_lag column is the one to distrust. It read 30 seconds here, and 42 seconds a minute later, while the standby itself reported its last replayed commit as 5 minutes 0.07 seconds old; during the main run it showed just under 3 minutes. Measure a delayed standby on the standby, with now() - pg_last_xact_replay_timestamp():
The test
PostgreSQL 18.6 on a Mac mini (Apple M4, internal SSD): a 1,597 MB database with pgbench at scale 100 plus an orders table of 1,000,000 rows. The application was two pgbench clients running the whole time: TPC-B at 300 transactions a second and 20 new orders a second. That load wrote WAL at about 198 MB a minute, around 11.6 GB an hour, a lot of it full-page images after each checkpoint. The standby had recovery_min_apply_delay = '5min', and a base backup with a WAL archive covered the PITR side.
Eight minutes in, the bad statement ran in a REPEATABLE READ transaction, so we could record exactly what it removed: 1,009,123 rows, their count, the sum of their ids and the highest id. Writes kept going. A minute later we "noticed".
Step one: pause replay
The first move, before thinking about anything else, is to stop the standby from applying the DELETE when its 5 minutes are up:
It took 0.04 s. The standby stayed open for reads and still showed 1,004,280 orders, as of 4 minutes before the mistake (5 minutes of delay, minus the minute it took us to notice). It keeps receiving WAL while paused, so nothing is lost; it just isn't applied.
If the newest few minutes don't matter, you can copy rows out right now. Here they did: 4,843 orders placed in those 4 minutes were deleted on the primary and not yet on the standby. To get every row, the standby has to move forward to the instant before the DELETE and stop there.
Step two: replay to just before the mistake
A recovery target does that. Targets are read at startup, so this is a restart of the standby, not a reload. The delay goes to 0 at the same time, or the standby would take another 5 minutes to get there:
It restarted, replayed the 4 minutes of WAL it was holding and stopped in 17.9 s. Its log said so:
The standby then had 1,009,153 orders: every deleted row, plus 30 orders that committed while the DELETE was running (they were inserted after its snapshot, so it never removed them, and they were still on the primary). Getting the rows back to the primary was a \copy out of the standby and an insert that skips what's already there:
That took 5.2 s and inserted 1,009,123 rows; the count, the sum of ids and the highest id on the primary matched what the DELETE had removed. From noticing to rows back: 23.9 s. With a real table you'd also think about rows the application changed after the DELETE (here, nothing could reference a deleted order), and about sequences, triggers and foreign keys on the way back in.
Finding the transaction
We knew the transaction id because our script asked for it. In real life you know roughly when it happened, and recovery_target_time a second before that is often good enough. When it isn't, pg_waldump finds the statement in the WAL archive in seconds. Our pgbench workload never deletes, so the transaction with a million heap DELETE records was easy to spot:
The second command gives the commit time to the microsecond, which also works as a recovery_target_time with recovery_target_inclusive = off.
The same rows from a backup
For comparison we restored the base backup taken before the test into a new directory and replayed the archive to the same transaction: copying the 1,638 MB backup took 12.9 s, replaying 2,479 MB of WAL took 72.6 s, and it stopped at the same point with the same 1,009,153 orders. 87.7 s in all, plus the same few seconds to copy rows back.
Replay ran at about 34 MB/s here. The WAL to replay grows with the age of the backup: at this lab's 11.6 GB an hour, a backup taken 12 hours earlier means about 139 GB of WAL and over an hour of replay, before counting the time to fetch backup and archive from wherever they're stored. Our point-in-time recovery article has a full run of that. The delayed standby always has at most the delay's worth of WAL to replay, and it's already on its disk.
What it costs
Disk on the standby
The standby keeps every bit of WAL it has received but not applied, so it needs room for the delay times your write rate. At 198 MB a minute, the gap between received and replayed settled at 991 MB, 5 minutes' worth, and the standby's pg_wal held 1,488 MB, because WAL is removed only at restartpoints. With a 1-hour delay the same load would need about 12 GB, plus max_wal_size. A 24-hour delay on a busy server is a lot of disk.
The primary didn't keep any extra. While the standby was connected, its slot advanced with what the standby had received, not what it had applied, and the primary's pg_wal stayed at about max_wal_size (1 GB).
Vacuum on the primary, if you turn on hot_standby_feedback
With hot_standby_feedback = on, the standby tells the primary the oldest transaction it might still need. On a delayed standby that is 5 minutes old by definition. The slot showed an xmin 96,176 transactions old, and a VACUUM of pgbench_accounts on the primary left 90,618 dead rows it wasn't allowed to remove. With a 1-hour delay that is an hour of dead rows on every busy table. With feedback off, the same VACUUM removed everything. Long reports running on the delayed standby may then be cancelled when replay reaches a cleanup they conflict with; run them on a normal replica instead.
A restart holds WAL on the primary
The surprise came after the recovery, when we put the standby back to its 5-minute delay and restarted it. It started up, began replaying the WAL already in its own pg_wal, waited at each commit for that commit's 5 minutes, and didn't connect to the primary again until it had worked through all of it: 4 minutes 29 seconds without streaming. In that time the slot on the primary kept 1,563 MB of WAL and still carried its old xmin, so vacuum on the primary was held back too. So after restarting a delayed standby, watch the primary's disk until pg_stat_replication lists it again, and budget the primary's WAL disk for a delay's worth of writes as well.
Once streaming again it went on to replay the bad DELETE and then the re-inserted rows, ending up identical to the primary. That is expected: the delayed standby replays history as it happened, mistake included.
The MySQL version: SOURCE_DELAY
MySQL has had delayed replication since 5.6. On 8.4 it's one option on the replica, set while the SQL (applier) thread is stopped:
SHOW REPLICA STATUS then shows it at work. Seconds_Behind_Source sits at the delay, which is what you want here, so alerts on that column need a different threshold for this replica:
Same test on MySQL 8.4 (source and a GTID replica on the same Mac): 1,000,000 orders, an application doing 200 balance updates and 20 new orders a second, DELETE FROM orders; (1,007,251 rows in 2.3 s), noticed 30 seconds later.
Stopping the SQL thread is the pause: 0.04 s, and the replica showed 1,001,838 orders, missing the 5,365 newest. To go forward to just before the DELETE, find its GTID in the source's binary log:
Then apply everything before that transaction, with the delay off, and stop:
The replica got there in 3.4 s and stopped with Executed_Gtid_Set ending one transaction short of the DELETE. It had 1,007,251 orders, exactly the number the DELETE reported. That's 48 more than a count(*) a moment before the DELETE: InnoDB's DELETE reads the latest committed rows, so orders inserted in between went too. mysqldump --no-create-info --insert-ignore --set-gtid-purged=OFF from the replica into the source put them back in 4.8 s, and the counts matched. From noticing to rows back: 9.6 s. (--set-gtid-purged=OFF matters: without it the dump tries to set GTID_PURGED on the source.)
The binary log here grew about 4 MB a minute (row events for small rows, no full-page images), so 5 minutes of relay log is small. MySQL removes relay log files only whole and once applied, so the space can reach a whole relay log file (max_relay_log_size, or max_binlog_size = 1 GB when that is 0, the default) plus the delay's worth of events. Then SOURCE_DELAY goes back on and START REPLICA SQL_THREAD resumes; like PostgreSQL, the replica will apply the DELETE and then your fix.
Making it work on the day
The first step is the one that has to be fast and automatic for whoever is on call: pause replay, before discussing anything. Everything after that can be done calmly, because the clock has stopped.
Keep a tab open on the delayed standby next to the primary: check how far behind it is, count rows on both sides, and copy what you need back without leaving the app. Pilotbase is free for Windows, macOS and Linux, or Docker on a server.
Get PilotbaseRelated: Point-in-time recovery in Postgres · Incremental backups built into Postgres 18 · Deleting millions of rows without hurting production
Sources: our own runs on PostgreSQL 18.6 and MySQL 8.4.11 (Homebrew, Apple M4), 30 October 2026. PostgreSQL 18 documentation: recovery_min_apply_delay and hot_standby_feedback, recovery targets, recovery control functions (pg_wal_replay_pause), pg_stat_replication, pg_waldump. MySQL 8.4 Reference Manual: delayed replication, START REPLICA ... UNTIL, mysqlbinlog row event display.