The retention job finally gets written: keep the last seven months of events, delete the rest. On our test table that meant 2,960,527 rows out of 10 million. The DELETE itself is one line. What it does to the application while it runs, to the replica, to vacuum and to the disk depends almost entirely on how you run it.
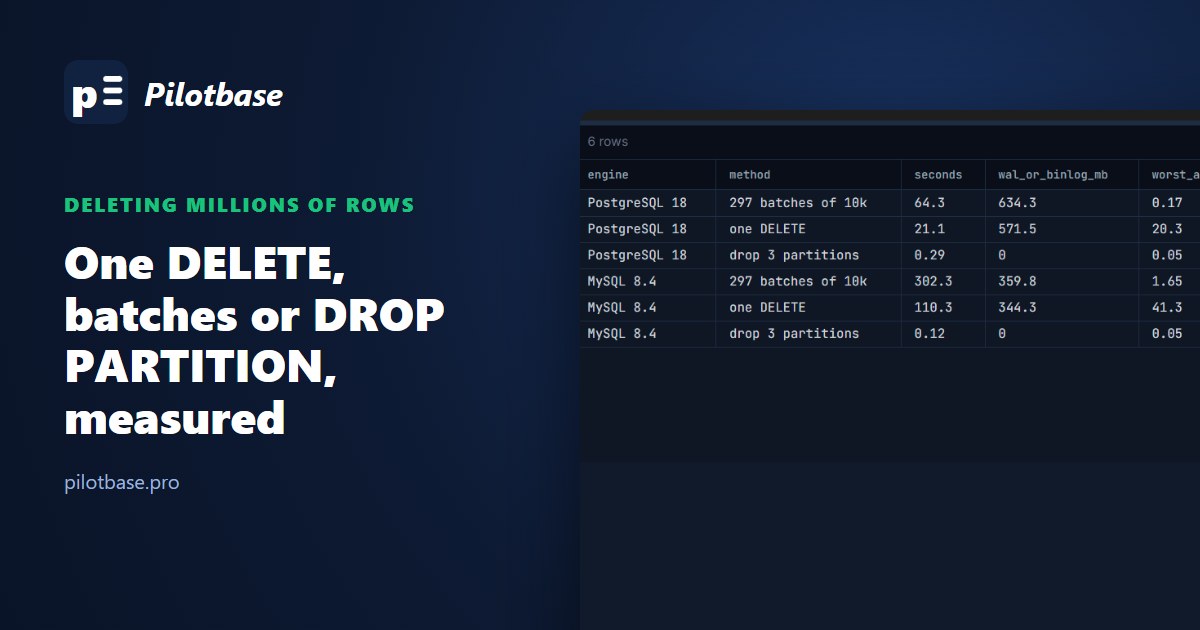
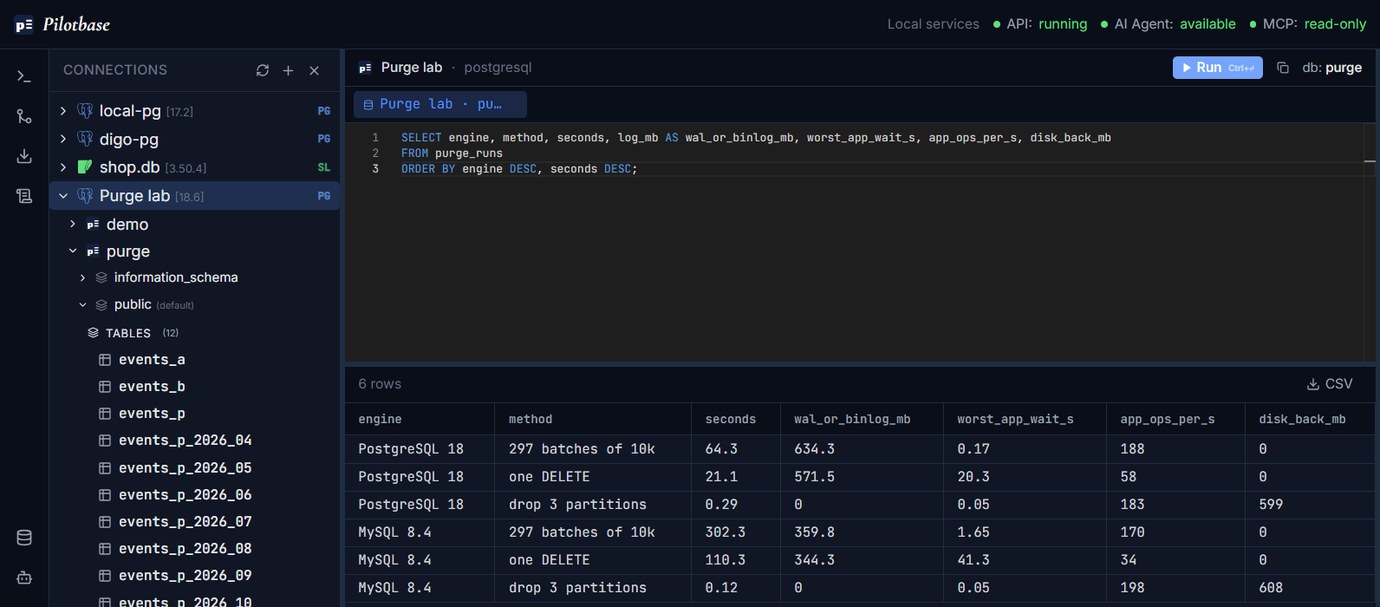
We purged the same three months three ways on PostgreSQL 18.6 and on MySQL 8.4.13: one DELETE, batches of 10,000 rows with a 0.1 s pause, and dropping monthly partitions. An application kept working against the table the whole time, and we recorded every one of its queries. Here is what came out.
The short version: batches take three times as long and nobody notices them; one big DELETE is quicker and stalls part of the application for its whole length; dropping a partition is instant and the only one of the three that gives disk space back. The details, and the traps in each, follow.
The test
One events table, 10,000,000 rows written in time order from 1 January to 31 October 2026 (about a million a month), with a bigint primary key, an index on created_at and one on account_id. Each row carries a 96-character payload. The purge removes everything before 1 April: 2,960,527 rows, 29.6% of the table.
Three identical copies of the table on each engine, one per method, so every run started from the same data. While each purge ran, a small Python program played the application: about 190 operations a second from six connections, 70% inserts of new events, 20% "latest 20 events for an account" reads and 10% updates of a random row anywhere in the table. That last part matters: about 30% of those updates land on a row the purge is deleting, the way a real app might still touch an old order or session.
Both servers ran in Docker on one Windows 11 machine (6 vCPUs and 12 GB for Docker, data on a local disk through a bind mount), with shared_buffers and innodb_buffer_pool_size raised to 1 GB and everything else at the defaults (max_wal_size 1 GB, autovacuum on, innodb_lock_wait_timeout 50 s, binlog on in ROW format). The PostgreSQL primary had a streaming replica on the same machine. A bind-mounted disk is slower than a server's NVMe, so treat the absolute times as pessimistic. The ratios between the methods are what carry over.
One big DELETE: fast, and it holds every row it touches
On PostgreSQL this took 21.1 s. Inserts and reads carried on almost untouched (inserts p99 41.8 ms, reads p99 43.6 ms). The updates did not. A DELETE locks each row as it reaches it and keeps every lock until it commits, so an update that hits one of those rows waits for the whole statement. Six updates waited more than a second; the longest waited 20.3 s, the full length of the DELETE.
Six blocked updates sound minor until you look at throughput. Our writer had six connections, as a small connection pool would. Each stuck update took a connection out of service, and the application's rate fell from 194 operations a second to 58 for the duration. On a web app that's requests piling up behind a pool that has quietly run dry.
MySQL was worse. The same DELETE took 110.3 s, InnoDB holds the same row locks, and innodb_lock_wait_timeout is 50 s by default. Seven updates gave up with ERROR 1205 (HY000): Lock wait timeout exceeded; try restarting transaction, the worst successful one waited 41.3 s, and throughput fell from 174 to 34 operations a second. If your application doesn't retry on 1205, those were seven failed requests.
The WAL and the replica
PostgreSQL 18 can report the WAL written by a single backend (pg_stat_get_backend_wal(pg_backend_pid())), so we read it before and after in the purging session: 2,960,572 records, 53,733 full-page images, 571.5 MB. That's about 200 bytes of WAL per deleted row, before vacuum adds its share.
The replica receives WAL as it is written, not at commit, and replays it on one process. Here that replay managed about 6.5 MB/s. By the time the DELETE committed, the replica was 402 MB behind (26 s by replay_lag), and 20 s later it was still 272 MB behind, so reads sent to it were around a minute stale. On faster disks the number shrinks, but the shape doesn't: the replica falls behind for as long as the primary writes WAL faster than one process can replay it.
Then autovacuum comes
A DELETE in PostgreSQL only marks rows dead. About a minute later autovacuum noticed 2.96 million dead tuples and cleaned them up. That took 41.9 s and wrote another 334 MB of WAL, 97,719 of its records full-page images, which the replica had to replay too. From the server log:
0 removed is the line about disk. The table was still 1,421 MB afterwards. More on that below.
Batches of 10,000: three times longer, and nobody notices
Each batch is its own transaction, so no row stays locked for longer than one batch. On PostgreSQL the 297 batches took a median of 0.111 s each (the slowest 0.249 s), 64.3 s in all including the pauses. The application's worst wait in that minute was 174 ms, no operation passed a second, and throughput stayed at 188 a second, the same as before the purge started.
The batches did not slow down as the purge went on: the first five took 0.075 to 0.108 s and the last five 0.03 to 0.23 s. That's worth checking on your own data, because the subquery scans the created_at index from its oldest end, past entries for rows already deleted. Here PostgreSQL's index scans marked those entries dead as they went, and the mid-purge autovacuum removed them. If your batches do get slower, walk the primary key in ranges instead (WHERE id > $last AND id <= $last + 10000 AND created_at < ...) so each batch starts where the last one ended.
The cost is in the totals. The batches wrote 634.3 MB of WAL, 11% more than the single DELETE (more transactions, and more full-page images as checkpoints came round during the longer run). The replica peaked at 203 MB behind, half the single DELETE's figure, and was caught up 16 s after the last batch.
Sizing the pause from the replica
The numbers above are enough to size the pause instead of guessing. Each batch wrote about 2.14 MB of WAL (634.3 MB / 297). With a 0.111 s batch and a 0.1 s pause, a cycle took 0.216 s, so the purge produced about 9.9 MB/s of WAL against a replay rate of about 6.5 MB/s. The replica fell behind by roughly 3.4 MB every second, about 220 MB over 64 seconds; we measured 203.
On a real server measure your own replay rate: run a few hundred batches and watch pg_wal_lsn_diff(pg_current_wal_lsn(), replay_lsn) in pg_stat_replication. Better still, let the loop check the lag itself, so it slows down when the replica or the disk is busy for some other reason:
The dead rows autovacuum leaves behind
One autovacuum ran in the middle of the batches (24.9 s, 146 MB of WAL) and removed 1.76 million dead entries. When the purge finished, another 1.13 million dead rows were left, and autovacuum never came back for them. The trigger is 50 + 20% of the table's estimated rows; with about 8.25 million rows at that point, that's roughly 1.65 million dead tuples, and 1.13 million is below it. They would have sat there, making index scans step over them, until enough new churn pushed the count over.
So finish a batched purge with a VACUUM of your own. On our table it took 4.6 s with two parallel workers for the indexes and removed 1,201,804 dead item identifiers. The autovacuum article covers lowering the per-table scale factor if purges like this are a regular thing.
MySQL batches
MySQL took 302.3 s for the same 297 batches, a median of 0.82 s each, with the first few at 3 to 4 s while the old part of the table came into the buffer pool. Nothing failed. The application's worst wait was 1.65 s and 29 of its 51,267 operations passed one second, against 41 seconds and seven timeouts for the single DELETE. Throughput held at 170 a second. As a stored procedure:
Binlog volume was about the same either way: the binary logs grew by 344 MB during the single DELETE and 360 MB during the batches, of which our writer's own traffic was a few megabytes. In ROW format with the default full row image, every deleted row goes into the binlog whole, about 115 bytes each here. The difference for a MySQL replica is when it can start. The single DELETE reaches the replica as one 340 MB transaction after the source commits, and the replica then spends at least as long applying it, so it is behind by the length of the DELETE plus the apply. Batches arrive as 297 small transactions it can apply as they come. (We measured replica lag on PostgreSQL only.)
Dropping partitions: 0.3 seconds, and the disk comes back
If the table is partitioned by month, a purge is no longer a DELETE at all. We loaded the same 10 million rows into a table partitioned by created_at, one partition a month:
Three months went in 0.29 s on PostgreSQL (each detach 0.02 to 0.08 s, each drop 0.05 to 0.07 s) and in 0.12 s on MySQL. Nothing is written row by row, so the WAL and binlog barely move and the replica didn't notice (0.1 MB behind at most). And the files are simply removed: PostgreSQL got 599 MB back at once (419 MB of table, 180 MB of indexes), MySQL 608 MB.
The catch is that a partition drop needs a stronger lock than a DELETE, even if only for a moment. We tested it with a report-style query left open in a transaction for 10 seconds, the detach starting a second later, and an ordinary application INSERT a second after that:
A plain DETACH wants an ACCESS EXCLUSIVE lock on the parent. It can't get it while the open transaction holds its lock, and while it waits in the queue every new query on the table queues behind it, including that INSERT. CONCURRENTLY takes only SHARE UPDATE EXCLUSIVE on the parent and waits for older transactions without blocking new ones. It can't run inside a transaction block, and it isn't allowed when the table has a DEFAULT partition. MySQL's DROP PARTITION needs an exclusive metadata lock and queues the same way.
Two settings keep a slow drop from turning into an outage. On PostgreSQL, SET lock_timeout = '2s' before a plain DETACH or the DROP TABLE, so it gives up instead of queuing everyone behind it, and retry later. On MySQL, SET SESSION lock_wait_timeout = 2; does the same for metadata locks (the default is a year). Before either, check what's running: lockTree draws the blocking tree from one pg_stat_activity query, so you can see the open transaction first.
Partitioning has to be in place before the purge, of course. Converting a 10-million-row table means copying it, and the primary key must include the partition column, which changes what uniqueness it can enforce (id alone is no longer guaranteed unique by the database). Create next months' partitions ahead of time from a scheduled job, or new rows have nowhere to go.
Getting the disk back after a DELETE
Neither engine shrinks a table after a DELETE. On PostgreSQL the 1,421 MB table and 507 MB of indexes were the same size after autovacuum; on MySQL the .ibd files were the same size (2,244 MB before, 2,248 MB after the single DELETE). The space is free inside the file and gets reused by new rows. Whether you need it back depends on how fast the table grows:
If you need it back sooner, you rebuild the table, and that's where the two engines differ:
OPTIMIZE TABLE on InnoDB is a rebuild (ALTER TABLE ... FORCE) that allows reads and writes while it runs. VACUUM FULL blocks every query on the table, reads included, for the full 103 seconds. On a busy PostgreSQL table use pg_repack, which rebuilds online and needs only short locks, or skip the rebuild and let new rows fill the space.
Which one to use
Whatever you choose, run the count first (SELECT count(*) FROM events WHERE created_at < '2026-04-01') and compare it with the rows deleted at the end. A purge with the wrong date in it is exactly the accident a restore you have tested is for. And if the table has child tables with foreign keys, index those columns first: every deleted parent row checks them.
Run the count, the batches and the VACUUM from one place, and keep an eye on the replica in a second tab. Pilotbase is free for Windows, macOS and Linux, or Docker on a server.
Get PilotbaseSomething stuck behind a purge or a partition drop? Paste one pg_stat_activity query into lockTree and see who blocks whom, with the line to cancel the root.
Open lockTreeSources: our own runs on PostgreSQL 18.6 and MySQL 8.4.13, 30 October 2026. PostgreSQL 18 documentation: ALTER TABLE (DETACH PARTITION CONCURRENTLY: two transactions, SHARE UPDATE EXCLUSIVE, no transaction block, no default partition), routine vacuuming (threshold 50 + 0.2 x reltuples), statistics functions (pg_stat_get_backend_wal). MySQL 8.4 Reference Manual: DELETE (LIMIT and ORDER BY, the copy-and-rename strategy), OPTIMIZE TABLE (recreate + analyze, online DDL), innodb_lock_wait_timeout and lock_wait_timeout.