Most test databases are filled with random(): a million orders, each assigned to a customer picked uniformly at random, each status equally likely, every timestamp spread evenly over two years. The queries run fast, the plans look fine, and then production turns out to have one customer with twenty thousand orders, a status that shows up in 3% of rows and a Monday peak. Uniform data can't show you a problem that only exists because real data is lopsided.
This article builds a realistic orders dataset in plain SQL, with no Faker script and no CSV to download: 100,000 customers and 1,000,453 orders with a skewed customer distribution, weighted statuses, log-normal amounts, NULLs where real exports have NULLs, and a weekly pattern. It's written for PostgreSQL 18, then repeated on MySQL 8.4 and SQLite 3.53, where the same query has a trap that silently skews your percentages. Every number below was measured on those three engines on a Mac mini; the scripts are kept with the article's change request.
The building blocks on Postgres
Four functions do most of the work. generate_series(1, 100000) returns one row per number. random() gives a float in [0, 1). Since PostgreSQL 16, random_normal(mean, stddev) gives a normal distribution, and since 17, random(1, 100000) gives a random integer in a range. setseed(0.42) at the start of the session makes the whole run repeatable, which matters when you want a test to fail the same way twice.
Repeating 'US' four times in the array is the cheapest way to weight a list: a third of customers land in the US, a sixth in the UK. CASE WHEN random() < 0.30 THEN NULL gives a 30% NULL rate, which is what a phone column looks like when it was optional at signup. Pick these numbers from a profile of your real data if you have one (more on that at the end).
Orders with a weekly rhythm
Spreading timestamps with random() * interval '730 days' gives the same number of orders on a Sunday as on a Monday. A better approach is to decide how many orders each day gets and then generate that many rows per day. A small days table holds the count, with weekends lower, Mondays higher and slow growth over the two years:
Then one row per order, joining each day to generate_series(1, n):
Each column uses a different trick:
Skewed customers. power(random(), 3) pushes most values toward 0, so low customer ids get far more orders. The result: customer 1 has 21,742 orders, customer 2 has 5,712, the median customer has 6, and about 1,000 customers have none. A uniform random() gave every customer between 1 and 25 orders. Raise the exponent for a longer tail, lower it for a flatter one.
Weighted statuses. One random number r per row, compared against cumulative thresholds: 80% delivered, 12% shipped, 5% cancelled, 3% refunded. The measured split was 80.0 / 12.0 / 5.0 / 3.0. The threshold trick only works if r is the same number in every WHEN, which is where MySQL and SQLite go wrong below.
Amounts. Order values are roughly log-normal: lots of small orders, a long tail of big ones. exp(random_normal(3.2, 0.9)) gave a median of 24.49, a 90th percentile of 77.62 and a 99th of 199.31. On engines without random_normal, the Box-Muller form exp(3.2 + 0.9 * sqrt(-2 * ln(1 - random())) * cos(2 * pi() * random())) gives the same distribution (24.59 median, 77.84 p90 here).
Time of day. The average of three random() values clusters around the middle, a cheap bell curve. Scaled into 08:00 to midnight, it put the peak at 15:00 to 16:00 with thin early mornings and late nights.
Two side notes from building this. First, row_number() OVER (ORDER BY created_at) makes ids increase with time, as they would with a sequence, so a range scan by id and by date hit the same pages. Second, an earlier version computed r with CROSS JOIN LATERAL (SELECT random() AS r). Because that subquery doesn't reference the outer row, Postgres evaluated it once for the whole query: every one of the million orders came out delivered. Put the random() call in a subquery that produces the rows themselves, as above.
What the uniform version hides
For comparison, a second table, orders_uniform, has the same row count with every column drawn uniformly. Both tables have a primary key and an index on customer_id, and both were analyzed. First, a query any app runs, a customer's 20 newest orders:
On uniform data the plan, a bitmap scan on customer_id followed by a sort, looks perfect: a dozen pages per call. On skewed data the same plan reads all 21,742 orders of the biggest customer, touching 7,886 of the table's 8,576 pages, to return 20 of them. Three milliseconds on a warm cache sounds harmless until it's the account page of your largest customer, called on every click, or the cache is cold. The fix, an index on (customer_id, created_at DESC), is obvious once you see it, and you only see it with data shaped like production. (With a plain index on created_at instead, Postgres walked it backwards for customer 1 and stopped after 20 matches, 13 buffers, because the statistics know that customer owns 2% of the rows. The composite index is still the one that serves every customer well.)
The statistics differ too. After ANALYZE on each table:
ANALYZE samples 30,000 rows, and on skewed data most of the sample is taken up by a few heavy customers, so the distinct estimate came out 2.4 times too low. That estimate feeds every GROUP BY customer_id and every join to customers; here the hash aggregate was planned for 41,766 groups and got 98,980. If you're testing a query whose plan depends on estimates, uniform data will agree with the planner far more than production does. The row estimates article covers what to do when the guesses are off, including ALTER TABLE ... ALTER COLUMN ... SET (n_distinct = ...).
Not everything changed. A prepared statement called five times for small customers and then for customer 1 kept getting custom plans (pg_prepared_statements showed 0 generic, 6 custom), so on this data the generic-plan trap didn't show up. It does show up when a generic plan's cost looks close to the custom plans' average, and only skewed data can give you that case at all.
MySQL 8.4: recursive CTEs, and a rand() that runs twice
MySQL has no generate_series. The usual replacement is a recursive CTE, and it hits a limit right away:
cte_max_recursion_depth defaults to 1000. Raise it for the session and keep the numbers in a table you can join to:
The rest translates almost line for line: rand() for random(), elt(1 + floor(rand() * 12), 'US', ...) for the array pick, pow() for power(), and the Box-Muller form for amounts. The days table uses a recursive CTE over dates, and orders join days to seq ON seq.n <= days.n.
Now the trap. Run the Postgres order query almost unchanged, with r computed once in a derived table, and the statuses come out wrong:
MySQL merges the derived table into the outer query, which replaces each reference to r with rand(), so every WHEN draws a new number. Delivered is still right (80%), but shipped is 20% × 92%, and so on down the chain. To prove it, count rows that fall into each of three ranges of r: on Postgres the counts add up to exactly 1,000,000; on MySQL they added up to 1,063,695. Rewriting the CASE as one elt(1 + (r >= 0.80) + (r >= 0.92) + (r >= 0.97), ...) expression didn't help either (71 / 26 / 2 / 0.07), because each comparison is still its own rand(). What worked was stopping the merge with an optimizer hint on the outer query:
Putting /*+ NO_MERGE() */ inside the derived table's own SELECT did nothing in our test; it has to name the derived table from the outer query. Adding a LIMIT to the derived table also prevents merging, according to the manual.
SQLite: the same trap, a different fix
SQLite's random() returns a signed 64-bit integer, not a float. 0.5 + random() / 18446744073709551616.0 turns it into [0, 1). Math functions such as exp, ln, sqrt, pow and pi are in the sqlite3 shell and in Python's bundled SQLite 3.53, but they're a compile-time option, so check your build. generate_series worked in the sqlite3 shell but not from Python (no such table: generate_series): it's an extension the shell includes, so a recursive CTE is the portable choice. Unlike MySQL there is no depth limit:
And the subquery trap is back: SQLite flattened the derived table and re-ran random() for each WHEN, giving 80.0 / 18.4 / 1.6 / 0.05. Here the fix is a materialized CTE, which SQLite has supported since 3.35:
The lesson for all three engines: after generating, check the distribution you meant to create. A GROUP BY status takes a second and would have caught both bugs in this article before any test ran against them.
Check the shape with a profile
Exporting a sample and profiling it is the quickest way to compare generated data with the real thing. Every 16th order, joined to the customer's country, went to a 3.3 MB CSV:
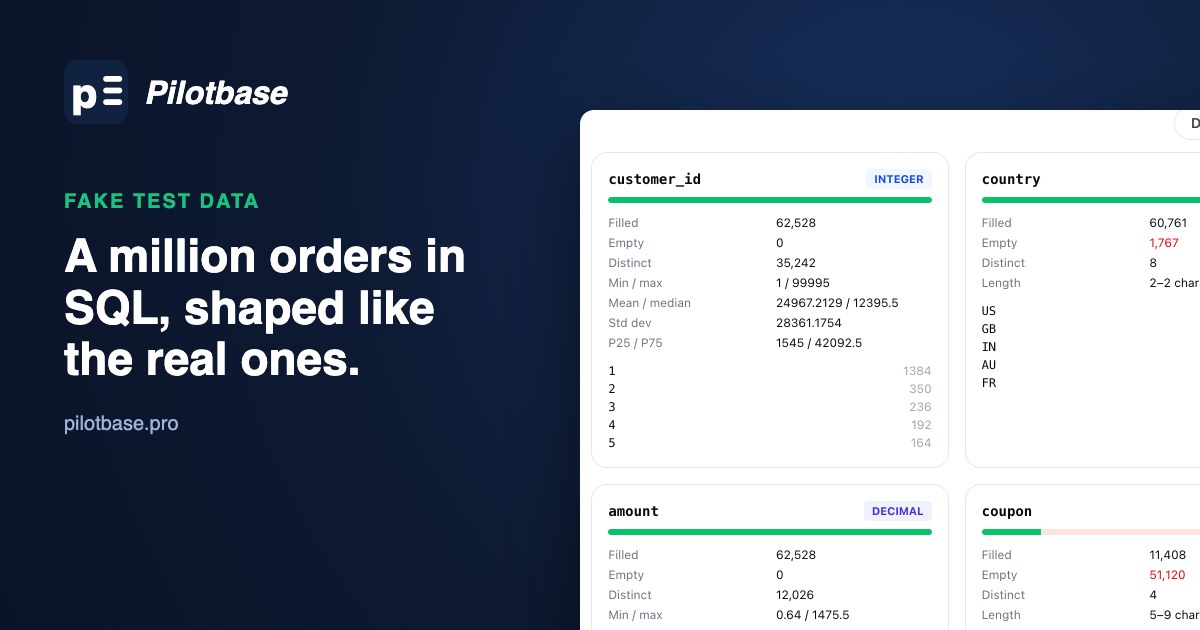
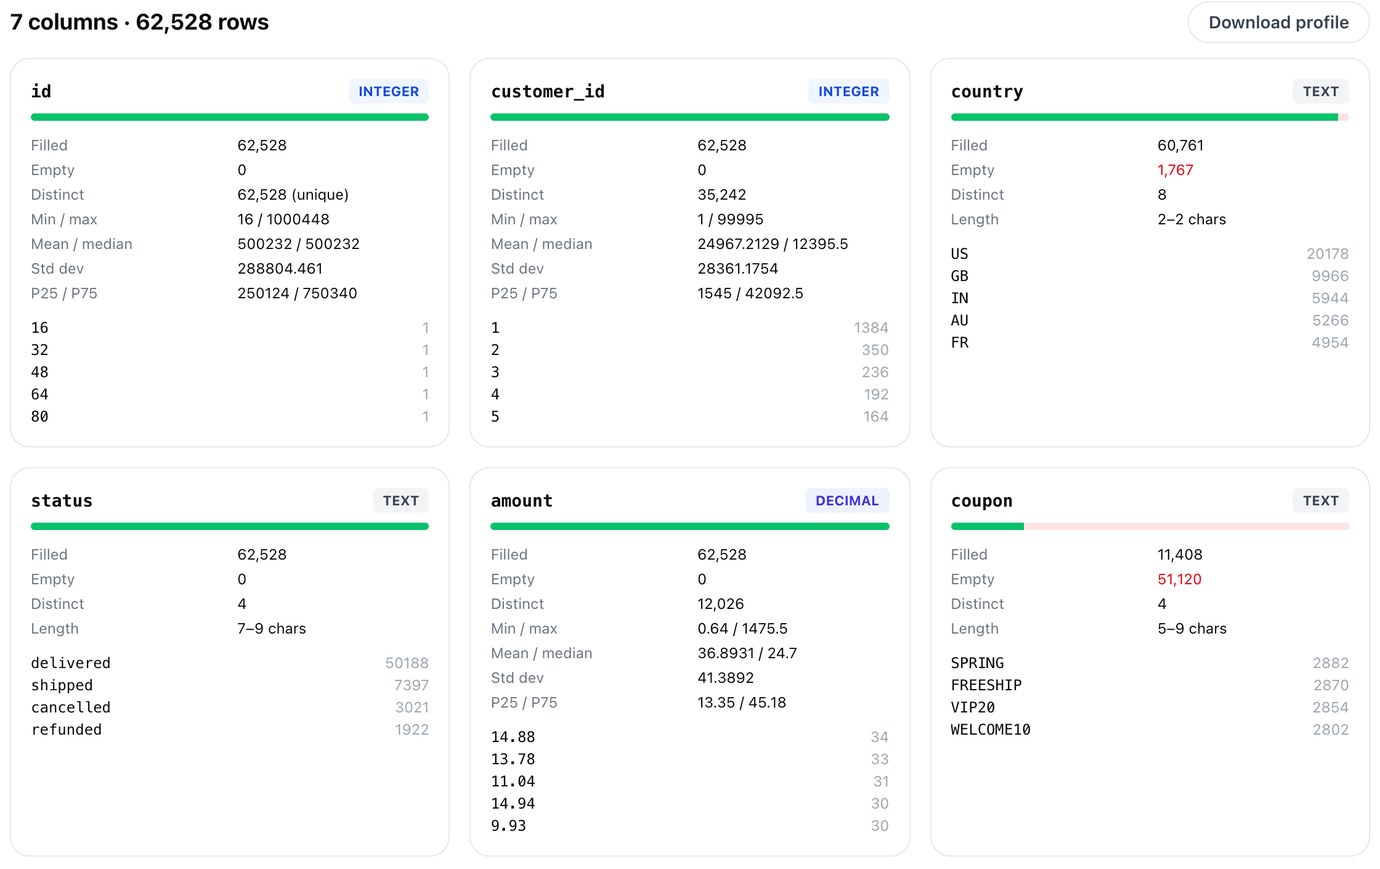
Dropped into csvProfiler, it shows what the SQL was supposed to do: customer 1 at the top with 1,384 of the 62,528 sampled orders and a median customer id of 12,395 against a range of 1 to 99,995, country empty in 1,767 rows (2.8%), coupon empty in 51,120 (82%), statuses in the 80/12/5/3 split, amounts from 0.64 to 1,475.50 with a median of 24.70.
It works the other way around too. Profile an anonymized export of the real table first, then copy its NULL rates, top values and percentiles into the generator. That's how you get test data that reproduces production's plans without copying production's customers.
A short checklist
Seed it: setseed() on Postgres, rand(42) for the first call on MySQL, so a failing test fails the same way next time. Skew the foreign keys: power(random(), k) or a weighted list, because the biggest customer, tenant or product is where plans break. Give rare values their real frequency: a 3% status is the one whose index gets used differently. Add NULLs where real data has them: they change selectivity, NOT IN results and index sizes. Put a pattern in time: weekdays, hours, growth, so date-range queries hit uneven pages. Then check the result with a GROUP BY or a profile before trusting it.
Two related reads: loading a million rows if your test data comes from a file instead, and OFFSET gets slower on every page, a problem that only shows up with enough rows.
Run the generator, then browse the tables, compare plans and watch sizes in one app for PostgreSQL, MySQL, SQLite and more. Pilotbase is free for Windows, macOS and Linux, or Docker on a server.
Get PilotbaseSources
PostgreSQL 18 documentation: random functions (random(min, max), random_normal, setseed), set returning functions (generate_series), planner statistics. MySQL 8.4 Reference Manual: recursive CTEs and cte_max_recursion_depth, derived table merging and NO_MERGE, optimizer hints. SQLite: random() and core functions, math functions, WITH and MATERIALIZED, generate_series. Measured in October 2026 on PostgreSQL 18.6, MySQL 8.4.11 and SQLite 3.53.4 on an Apple-silicon Mac mini.
Comments (0)
Loading comments…