A CSV that opens fine is not a CSV that imports fine. Before you point an importer at a file, five quick checks on its columns tell you what will break, and most of them take seconds. To show them on something real, we ran all five on one public file: 50,000 rows of New York City crash records, 29 columns, 13.8 MB.
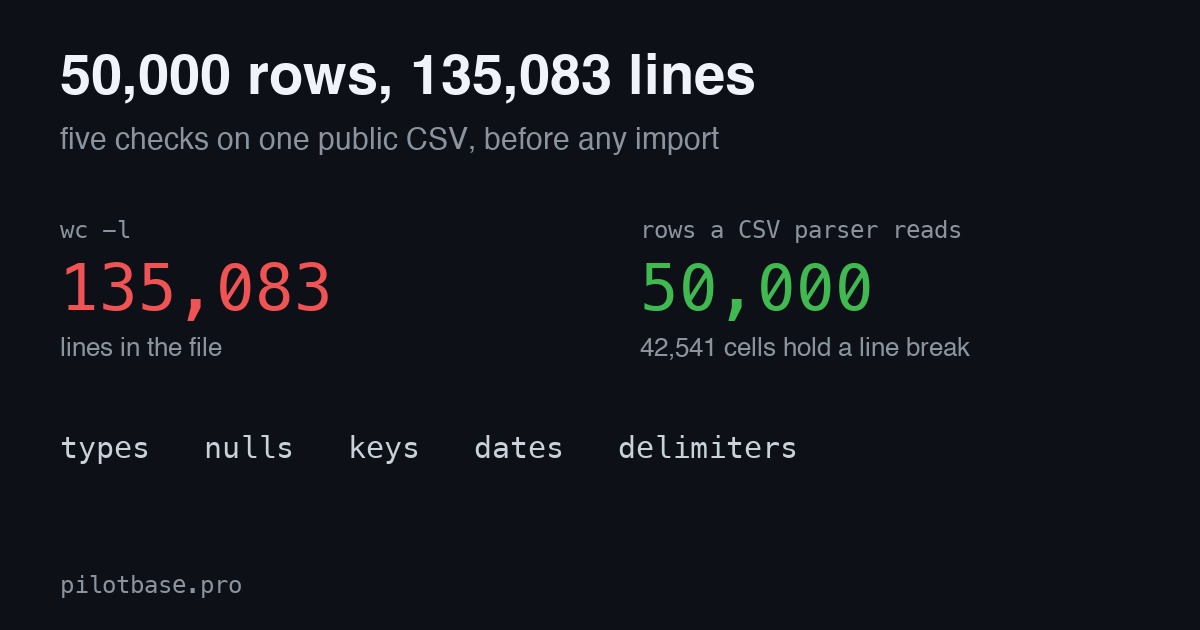
The headline: wc -l says the file has 135,083 lines. It has 50,000 rows. 42,541 of them carry a line break inside one cell. Everything else in the file is surprisingly tidy, which is the point: the checks tell you which problems you have and which you don't, so you don't clean what isn't broken.
The file
It is the NYC Open Data table "Motor Vehicle Collisions - Crashes" (resource h9gi-nx95), the first 50,000 rows by crash date. Anyone can fetch the same file:
We fetched it on 2026-11-22: 13,816,408 bytes, crashes from 2012-07-01 to 2012-09-29, 29 columns. The city updates this dataset, so a later download can differ a little; the SHA-256 of ours starts eded590d9a51. No database is involved anywhere below: every number comes from reading the file. The 13.8 MB is over the guest size of csvProfiler (5 MB), so open it signed in with the free account, or cut the file first (a warning on that in check 5).
We ran the checks with a short script that follows the same rules csvProfiler uses, and confirmed the row count with papaparse, the parser csvProfiler reads files with. What csvProfiler shows for each column is what the first four checks use: the guessed type, filled and empty counts, distinct count and the five most common values.
Check 1: what type does each column look like?
Types come from the values, not from what the column means. Run the guess and compare it with what you know about the column.
Three guesses are worth a second look:
zip_code is an integer. All 38,616 filled values are five digits, so nothing is lost here. That is luck of geography: New York ZIP codes start with 1. A ZIP is a label, not a number, and the same file from New Jersey would lose its leading zero the day someone stores it as an integer. Store it as text. The leading-zero article has the long version.
crash_date is a date, but every one of the 50,000 values ends in T00:00:00.000. It is a date wearing a timestamp. The time of day lives in a separate crash_time column, guessed as text because 15:53 is not a date. You will join the two.
collision_id is text. 32 hex characters on every row, so a number would be wrong here. Good guess.
One more thing about the guess itself. csvProfiler decides a column's type from its first 5,000 rows. We checked the guess on the first 5,000 rows and on all 50,000: none of the 29 columns changed. If a column is clean for 5,000 rows and has an N/A at row 30,000, the guess can be wrong, so for columns that matter, look at the filled and distinct counts, and the minimum and maximum length, which cover every row.
Check 2: how empty is each column?
Count the empty cells per column, and then count the placeholders that look filled but say nothing.
What this tells you:
Columns 3, 4 and 5 of each repeating group are almost always empty (93 to 99.7%). That is the shape of a wide table where most crashes involve one or two vehicles. It is a hint to ask whether a vehicles table, one row per vehicle, would suit you better than five pairs of columns.
Empties come in pairs. latitude and longitude are empty on exactly the same 7,459 rows, and no row has one without the other. borough and zip_code are empty on 11,380 and 11,384 rows: four rows have a borough and no ZIP, none the other way round.
Empty does not mean unknowable. 3,921 rows with no borough do have coordinates, so a lookup could fill them in.
Placeholders hide in the filled cells. contributing_factor_vehicle_1 is Unspecified on 29,778 rows (59.6%), and contributing_factor_vehicle_2 is Unspecified on 40,694 (81.4%) on top of its 4,827 empties, so 91.0% of that column says nothing. vehicle_type_code1 says UNKNOWN on 1,482 rows. A null count alone would call these columns full.
A rule that works: for each column, add the empty count and the count of the top value if it is a placeholder word. If the total is over half the rows, decide on purpose whether the column belongs in the table.
Check 3: is the key really a key?
Take the column you will make the primary key and count: rows, filled, distinct.
The key is clean: a PRIMARY KEY on collision_id will load. Now the check people skip: a unique key does not mean unique rows. Compare the rows with the key column left out:
Thirty-three extra rows out of 50,000 (0.07%). None of the pairs sit next to each other in the file, and six of them have injuries, which would be counted twice in a total. They may be one crash reported twice or two real crashes at one spot and minute, and the data cannot say which. So the check's output is a list to look at, not a delete. If they are duplicates, removing duplicate rows in SQL shows how to keep one; if the same person appears with small spelling differences, near-duplicate matching is the next step.
Also test the key for case and spaces (ABC and abc as two keys). Here, 50,000 distinct before and after trimming and lower-casing.
Check 4: do the dates have one shape?
Replace every digit with a 9 and count the shapes. One shape means one format. Two or more means mixed formats, and the order of day and month is the first thing to confirm.
Both columns have one shape, and the date is year first, so there is no 03/04 puzzle here (that one has its own article). Check the range too: the minimum and maximum should fit the story. Ours do, and no value is outside it.
What the shape check does not catch is how the values were made. Look at the minutes of crash_time:
Almost one crash in five is logged at an exact hour, ten times what chance would give. These are times people estimated or rounded, so do not build "which minute is worst" on them; hours are safe. And the file has no time zone, so treat the times as New York local time and say so in your column name or notes.
Check 5: do the lines match the rows?
This is the check that found the real problem. Count physical lines, then count rows with a proper CSV parser, and compare.
The file is valid CSV. The location column holds a value like this, in quotes, on 42,541 rows:
Each of those rows takes three lines in the file. Anything that splits on line breaks sees something else:
So a line-based tool would call 42,541 of the 50,000 rows (85.1%) broken. Two more consequences:
Do not cut this file with head -n or split -l. head -n 5000 gives you 1,849 rows, and a cut can land in the middle of a record. Open it in bigCsv and query the part you need with SQL instead of cutting the file.
The cell is also untidy. Even trimmed, location starts with , and holds a line break. It is a copy of latitude and longitude (all 50,000 rows match), so the easy fix is to drop the column and keep the two numbers.
While you are looking at delimiters, check three more things we did: no byte-order mark at the start, no Windows \r\n endings (the file uses \n), and no semicolons or tabs hiding in cells. Eleven cells have a comma in a street name and are properly quoted. If your file starts with , or shows é where an accent should be, read the mojibake article.
What the five checks found, side by side
A few minutes of looking, no import, and you know what the table should be before you build it. Compare that with the other order: load first, then wonder why the row count is off. The file is a good reminder that clean-looking data still has surprises, and that most of them are findable by counting.
A plain order to do it in
1. Count lines and count rows with a parser. If they differ, you have line breaks inside cells.
2. Open the file in csvProfiler and read the type, empty and distinct columns.
3. Add up empties and placeholders per column.
4. Count distinct on the key; compare rows with the key left out.
5. Reduce every date and time to a shape and count the shapes.
6. Write down your decisions (types, key, what is NULL) before building the table.
We did not load this file into a database for this article. When you do, a messy CSV into Postgres walks through the clean and load steps that follow.
Profile your own CSV in the browser: types, empties, distinct counts and top values for every column. The file stays on your machine.
Open csvProfilerOnce the table is built, Pilotbase is a database client for Windows, macOS and Linux, or Docker on a server: load the file, query it and look at the rows.
Get Pilotbase